This is the multi-page printable view of this section. Click here to print.
Tools and languages
1 - bpftrace
bpftrace is a powerful, high-level tracing language for Linux that simplifies the process of creating eBPF (Extended Berkeley Packet Filter) programs. It simplifies the process of instrumenting kernel and user-space code by providing a simple language to attach probes to kernel functions, tracepoints, and user-defined events in a user-friendly syntax, inspired by awk, C, and other tracing tools, enabling users to quickly gain insights into system behavior. By abstracting away the complexities of low-level eBPF programming and leveraging libbpf as its backend, bpftrace allows system administrators, performance engineers, and developers to easily observe and analyze system performance without requiring extensive eBPF expertise. Let’s start by looking at the bpftrace command.
bpftrace Options
When running bpftrace, you can use various command-line options to control its behavior. Some commonly used options include:
OPTIONS:
    -B MODE        output buffering mode ('full', 'none')
    -f FORMAT      output format ('text', 'json')
    -o file        redirect bpftrace output to file
    -e 'program'   execute this program
    -h, --help     show this help message
    -I DIR         add the directory to the include search path
    --include FILE add an #include file before preprocessing
    -l [search|filename]
                   list kernel probes or probes in a program
    -p PID         enable USDT probes on PID
    -c 'CMD'       run CMD and enable USDT probes on resulting process
    --usdt-file-activation
                   activate usdt semaphores based on file path
    --unsafe       allow unsafe/destructive functionality
    -q             keep messages quiet
    --info         Print information about kernel BPF support
    -k             emit a warning when a bpf helper returns an error (except read functions)
    -kk            check all bpf helper functions
    -V, --version  bpftrace version
    --no-warnings  disable all warning messages
For example, we can use -l along with * for wildcard for listing such as listing all kprobes:
sudo bpftrace -l 'kprobe:*'
[...]
kprobe:zswap_store
kprobe:zswap_swapoff
kprobe:zswap_swapon
kprobe:zswap_total_pages
kprobe:zswap_writeback_entry
kprobe:zswap_writeback_show
kprobe:zswap_writeback_write
kprobe:zswap_zpool_param_set
We can list probe parameters for a certain function using
sudo bpftrace -lv 'fentry:tcp_reset'
fentry:vmlinux:tcp_reset
    struct sock * sk
    struct sk_buff * skb
We can list all symbols from object or binary files for uprobe such as the following:
sudo bpftrace -l 'uprobe:/bin/bash:*'
[...]
uprobe:/bin/bash:async_redirect_stdin
uprobe:/bin/bash:base_pathname
uprobe:/bin/bash:bash_add_history
uprobe:/bin/bash:bash_brace_completion
uprobe:/bin/bash:bash_clear_history
uprobe:/bin/bash:bash_default_completion
uprobe:/bin/bash:bash_delete_histent
uprobe:/bin/bash:bash_delete_history_range
uprobe:/bin/bash:bash_delete_last_history
uprobe:/bin/bash:bash_dequote_text
[...]
Using -e can be used to execute a program in one-liner. For example,
sudo bpftrace -e 'uprobe:/bin/bash:shell_execve { printf("shell_execve called\n"); }'
Attaching 1 probe...
open() called
open() called
open() called
This program uprobe:/bin/bash:shell_execve { printf("shell_execve called\n"); } means this action printf("shell_execve called\n"); will be executed when uprobe:/bin/bash:shell_execve get triggered.
If we want to print out which command is being executed is by printing the first argument with arg0 using str function which reads a NULL terminated string similar to bpf_probe_read_str helper function. argN is a bpf builtins while hold arguments passed to the function being traced and it can be used with kprobe and uprobe.
sudo bpftrace -e 'uprobe:/bin/bash:shell_execve { printf("command:%s\n", str(arg0)); }'
Attaching 1 probe...
command:/usr/bin/ls
command:/usr/bin/ping
command:/usr/bin/cat
The following table is from the bpftrace manual, listing special variables along with their corresponding helper functions and descriptions.
| Variable | BPF Helper | Description |
|---|---|---|
$1, $2, ...$n |
n/a | The nth positional parameter passed to the bpftrace program. If less than n parameters are passed this evaluates to 0. For string arguments use the str() call to retrieve the value. |
$# |
n/a | Total amount of positional parameters passed. |
arg0, arg1, ...argn |
n/a | nth argument passed to the function being traced. These are extracted from the CPU registers. The amount of args passed in registers depends on the CPU architecture. (kprobes, uprobes, usdt). |
args |
n/a | The struct of all arguments of the traced function. Available in tracepoint, fentry, fexit, and uprobe (with DWARF) probes. Use args.x to access argument x or args to get a record with all arguments. |
cgroup |
get_current_cgroup_id | ID of the cgroup the current process belongs to. Only works with cgroupv2. |
comm |
get_current_comm | Name of the current thread. |
cpid |
n/a | Child process ID, if bpftrace is invoked with -c. |
cpu |
raw_smp_processor_id | ID of the processor executing the BPF program. |
curtask |
get_current_task | Pointer to struct task_struct of the current task. |
elapsed |
ktime_get_ns / ktime_get_boot_ns | Nanoseconds elapsed since bpftrace initialization, based on nsecs. |
func |
n/a | Name of the current function being traced (kprobes, uprobes). |
gid |
get_current_uid_gid | Group ID of the current thread, as seen from the init namespace. |
jiffies |
get_jiffies_64 | Jiffies of the kernel. In 32-bit systems, using this builtin might be slower. |
numaid |
numa_node_id | ID of the NUMA node executing the BPF program. |
pid |
get_current_pid_tgid | Process ID of the current thread (aka thread group ID), as seen from the init namespace. |
probe |
n/a | Name of the current probe. |
rand |
get_prandom_u32 | Random number. |
return |
n/a | The return keyword is used to exit the current probe. This differs from exit() in that it doesn’t exit bpftrace. |
retval |
n/a | Value returned by the function being traced (kretprobe, uretprobe, fexit). For kretprobe and uretprobe, its type is uint64, but for fexit it depends. You can look up the type using bpftrace -lv. |
tid |
get_current_pid_tgid | Thread ID of the current thread, as seen from the init namespace. |
uid |
get_current_uid_gid | User ID of the current thread, as seen from the init namespace. |
The following table is from the bpftrace manual, listing bpftrace functions along with their corresponding descriptions.
| Name | Description |
|---|---|
| bswap | Reverse byte order |
| buf | Returns a hex-formatted string of the data pointed to by d |
| cat | Print file content |
| cgroupid | Resolve cgroup ID |
| cgroup_path | Convert cgroup id to cgroup path |
| exit | Quit bpftrace with an optional exit code |
| join | Print the array |
| kaddr | Resolve kernel symbol name |
| kptr | Annotate as kernelspace pointer |
| kstack | Kernel stack trace |
| ksym | Resolve kernel address |
| len | Count ustack/kstack frames |
| macaddr | Convert MAC address data |
| nsecs | Timestamps and Time Deltas |
| ntop | Convert IP address data to text |
| offsetof | Offset of element in structure |
| override | Override return value |
| path | Return full path |
| percpu_kaddr | Resolve percpu kernel symbol name |
| Print a non-map value with default formatting | |
| printf | Print formatted |
| pton | Convert text IP address to byte array |
| reg | Returns the value stored in the named register |
| signal | Send a signal to the current process |
| sizeof | Return size of a type or expression |
| skboutput | Write skb ’s data section into a PCAP file |
| str | Returns the string pointed to by s |
| strcontains | Compares whether the string haystack contains the string needle. |
| strerror | Get error message for errno code |
| strftime | Return a formatted timestamp |
| strncmp | Compare first n characters of two strings |
| system | Execute shell command |
| time | Print formatted time |
| uaddr | Resolve user-level symbol name |
| uptr | Annotate as userspace pointer |
| ustack | User stack trace |
| usym | Resolve user space address |
How to Code in bpftrace
bpftrace scripts are written using a custom domain-specific language (DSL) that is similar in syntax to awk. A basic script consists of one or more probe definitions followed by one or more actions. Each probe targets a specific event (e.g., kernel tracepoints, function entry/exit, or user-space events).
The following table is from the bpftrace manual, listing bpftrace probes along with their corresponding descriptions.
| Probe Name | Short Name | Description | Kernel/User Level |
|---|---|---|---|
| BEGIN/END | - | Built-in events | Kernel/User |
| self | - | Built-in events | Kernel/User |
| hardware | h |
Processor-level events | Kernel |
| interval | i |
Timed output | Kernel/User |
| iter | it |
Iterators tracing | Kernel |
| fentry/fexit | f/fr |
Kernel functions tracing with BTF support | Kernel |
| kprobe/kretprobe | k/kr |
Kernel function start/return | Kernel |
| profile | p |
Timed sampling | Kernel/User |
| rawtracepoint | rt |
Kernel static tracepoints with raw arguments | Kernel |
| software | s |
Kernel software events | Kernel |
| tracepoint | t |
Kernel static tracepoints | Kernel |
| uprobe/uretprobe | u/ur |
User-level function start/return | User |
| usdt | U |
User-level static tracepoints | User |
| watchpoint/asyncwatchpoint | w/aw |
Memory watchpoints | Kernel |
Basic Structure of a bpftrace Script
probe_type:probe_identifier
{
    // Action code block
    printf("Hello, world!\n");
}
For example, to print a message every time a process calls the unlinkat() syscall, you might write:
#!/usr/bin/env bpftrace

tracepoint:syscalls:sys_enter_unlinkat
{
    printf("unlinkat syscall invoked\n");
}
sys_enter_unlinkat tracepoint’s arguments can be listed from /sys/kernel/debug/tracing/events/syscalls/sys_enter_unlinkat/format
name: sys_enter_unlinkat
ID: 849
format:
	field:unsigned short common_type;	offset:0;	size:2;	signed:0;
	field:unsigned char common_flags;	offset:2;	size:1;	signed:0;
	field:unsigned char common_preempt_count;	offset:3;	size:1;	signed:0;
	field:int common_pid;	offset:4;	size:4;	signed:1;

	field:int __syscall_nr;	offset:8;	size:4;	signed:1;
	field:int dfd;	offset:16;	size:8;	signed:0;
	field:const char * pathname;	offset:24;	size:8;	signed:0;
	field:int flag;	offset:32;	size:8;	signed:0;

print fmt: "dfd: 0x%08lx, pathname: 0x%08lx, flag: 0x%08lx", ((unsigned long)(REC->dfd)), ((unsigned long)(REC->pathname)), ((unsigned long)(REC->flag))
Therefore, we can use str(args.pathname) to extract the name of the file being deleted. args is one of the bpftrace builtins which is a data struct of all arguments of the traced function and it can be used with tracepoint, fentry, fexit.
#!/usr/bin/env bpftrace

tracepoint:syscalls:sys_enter_unlinkat
{
    printf("Process %s (PID: %d) is deleting a file %s\n", comm, pid, str(args.pathname));
}
Attaching 1 probe...
Process rm (PID: 2269) is deleting a file test1
Process rm (PID: 2270) is deleting a file test2
Let’s convert this eBPF kernel code to bpftrace
#define __TARGET_ARCH_x86
#include "vmlinux.h"
#include <bpf/bpf_helpers.h>
#include <bpf/bpf_tracing.h>
#include <bpf/bpf_core_read.h>

struct event {
    pid_t pid;
    char filename[256];
    umode_t mode;
};

struct {
    __uint(type, BPF_MAP_TYPE_PERF_EVENT_ARRAY); // Type of BPF map
    __uint(max_entries, 1024);                   // Maximum number of entries in the map
    __type(key, int);                            // Type of the key
    __type(value, int);                          // Type of the value
} mkdir SEC(".maps");

char LICENSE[] SEC("license") = "Dual BSD/GPL";

SEC("kprobe/do_mkdirat")
int BPF_KPROBE(do_mkdirat, int dfd, struct filename *name, umode_t mode)
{
    pid_t pid = bpf_get_current_pid_tgid() >> 32;
    struct event ev = {};
    ev.pid = pid;
    ev.mode = mode;
    const char *filename = BPF_CORE_READ(name, name);
    bpf_probe_read_str(ev.filename, sizeof(ev.filename), filename);
    bpf_perf_event_output(ctx, &mkdir, BPF_F_CURRENT_CPU, &ev, sizeof(ev));
    return 0;
}
Let’s build the same code without Maps as it will be explained shortly
#!/usr/bin/env bpftrace

kprobe:do_mkdirat
{
  printf("PID: %d, mode: %d, filename: %s\n", pid, arg2, str(((struct filename *)arg1)->name));
}
The idea is to cast arg1 to a pointer to struct filename before accessing name field.
bpftrace Maps
Maps in bpftrace are defined with @ such as @testmap. The following table is from bpftrace manual, listing bpftrace map functions along with their corresponding descriptions.
| Name | Description |
|---|---|
| avg | Calculate the running average of n between consecutive calls. |
| clear | Clear all keys/values from a map. |
| count | Count how often this function is called. |
| delete | Delete a single key from a map. |
| has_key | Return true (1) if the key exists in this map. Otherwise return false (0). |
| hist | Create a log2 histogram of n using buckets per power of 2, 0 <= k <= 5, defaults to 0. |
| len | Return the number of elements in a map. |
| lhist | Create a linear histogram of n. lhist creates M ((max - min) / step) buckets in the range [min, max) where each bucket is step in size. |
| max | Update the map with n if n is bigger than the current value held. |
| min | Update the map with n if n is smaller than the current value held. |
| stats | Combines the count, avg and sum calls into one. |
| sum | Calculate the sum of all n passed. |
| zero | Set all values for all keys to zero. |
#include "vmlinux.h"
#include <bpf/bpf_helpers.h>
#include <bpf/bpf_core_read.h>

struct {
    __uint(type, BPF_MAP_TYPE_HASH);
    __uint(max_entries, 1024);
    __type(key, u32);
    __type(value, u8);
} forks SEC(".maps");

struct {
    __uint(type, BPF_MAP_TYPE_HASH);
    __uint(max_entries, 1024);
    __type(key, u32);
    __type(value, u8);
} setuid SEC(".maps");

SEC("tracepoint/syscalls/sys_enter_fork")
int trace_fork(struct trace_event_raw_sys_enter *ctx)
{
    u32 pid = bpf_get_current_pid_tgid() >> 32;
    u8 val = 1;

    bpf_map_update_elem(&forks, &pid, &val, BPF_ANY);
    bpf_printk("Fork detected: PID %d\n", pid);
    return 0;
}

SEC("tracepoint/syscalls/sys_enter_setuid")
int trace_setuid(struct trace_event_raw_sys_enter *ctx)
{
    u32 uid = ctx->args[0];
    if (uid == 0) {
        u32 pid = bpf_get_current_pid_tgid() >> 32;
        u8 val = 1;
        bpf_map_update_elem(&setuid, &pid, &val, BPF_ANY);
        bpf_printk("Setuid detected: PID %d\n", pid);
    }
    return 0;
}

SEC("tracepoint/syscalls/sys_enter_execve")
int trace_execve(struct trace_event_raw_sys_enter *ctx)
{
    u32 pid = bpf_get_current_pid_tgid() >> 32;
    u8 *forked = bpf_map_lookup_elem(&forks, &pid);
    u8 *priv = bpf_map_lookup_elem(&setuid, &pid);

    if (forked && priv) {
        bpf_printk("Privilege escalation detected: fork, setuid(0), execve, PID %d\n", pid);
        bpf_send_signal(9);
    }
    return 0;
}

char LICENSE[] SEC("license") = "GPL";
Let’s see the previous code in bpftrace:
#!/usr/bin/env bpftrace

tracepoint:syscalls:sys_enter_fork
{
    @forks[pid] = 1;
    printf("Fork detected: PID %d\n", pid);
}

tracepoint:syscalls:sys_enter_setuid
{
    if (uid == 0)
    {
        @setuid[pid] = 1;
        printf("Setuid detected: PID %d\n", pid);
    }
}

tracepoint:syscalls:sys_enter_execve
{
    if (@forks[pid] == 1 && @setuid[pid] == 1)
    {
        printf("Privilege escalation detected: fork, setuid(0), execve, PID %d\n", pid);
        signal(9)
    }
}
Define a map named forks, and when the sys_enter_setuid tracepoint is triggered, insert the current pid as the key with a value of 1.
@forks[pid] = 1;
Define a map named setuid, and when the sys_enter_fork tracepoint is triggered with a UID of zero, insert the current pid as the key and 1 as the value.
@setuid[pid] = 1;
If sys_enter_execve is triggered, then it will check if the current pid triggered by sys_enter_setuid and sys_enter_fork
if (@forks[pid] == 1 && @setuid[pid] == 1)
signal function is equivalent to bpf_send_signal helper function to terminate the process.
signal(9)
We have to run this code with --unsafe because we running dangerous function which is signal, then to run it sudo bpftrace --unsafe priv-esc.bt.
This code is much smaller and simpler than eBPF kernel code, and no need for user-space code.
The next script attaches probes to the sys_enter_read and sys_enter_write syscalls (separated with comma ,) and uses a map to count the number of system calls per process using count() map function.
#!/usr/bin/env bpftrace

tracepoint:syscalls:sys_enter_read,
tracepoint:syscalls:sys_enter_write
{
    @syscalls[comm] = count();
}

interval:s:5 {
   printf("\033[H\033[2J");
   print(@syscalls);
}
This will activate every 5 seconds (using interval probe) to clear the screen using ANSI escape sequences printf("\033[H\033[2J");, then print the content of syscalls map.
interval:s:5 {
   printf("\033[H\033[2J");
   print(@syscalls);
}
@syscalls[systemd-timesyn]: 1
@syscalls[systemd-journal]: 1
@syscalls[systemd]: 4
@syscalls[rtkit-daemon]: 8
@syscalls[sudo]: 10
@syscalls[gnome-shell]: 13
@syscalls[gvfsd-wsdd]: 16
@syscalls[bash]: 20
@syscalls[ls]: 26
@syscalls[bpftrace]: 47
@syscalls[sshd-session]: 818
bpftrace Tools
The following tools from bpftrace github repository. They cover a wide range of functions from tracing I/O and network events to monitoring process and syscall activity.
| Name | Description |
|---|---|
| bashreadline.bt | Print entered bash commands system wide. Examples. |
| biolatency.bt | Block I/O latency as a histogram. Examples. |
| biosnoop.bt | Block I/O tracing tool, showing per I/O latency. Examples. |
| biostacks.bt | Show disk I/O latency with initialization stacks. Examples. |
| bitesize.bt | Show disk I/O size as a histogram. Examples. |
| capable.bt | Trace security capability checks. Examples. |
| cpuwalk.bt | Sample which CPUs are executing processes. Examples. |
| dcsnoop.bt | Trace directory entry cache (dcache) lookups. Examples. |
| execsnoop.bt | Trace new processes via exec() syscalls. Examples. |
| gethostlatency.bt | Show latency for getaddrinfo/gethostbyname[2] calls. Examples. |
| killsnoop.bt | Trace signals issued by the kill() syscall. Examples. |
| loads.bt | Print load averages. Examples. |
| mdflush.bt | Trace md flush events. Examples. |
| naptime.bt | Show voluntary sleep calls. Examples. |
| opensnoop.bt | Trace open() syscalls showing filenames. Examples. |
| oomkill.bt | Trace OOM killer. Examples. |
| pidpersec.bt | Count new processes (via fork). Examples. |
| runqlat.bt | CPU scheduler run queue latency as a histogram. Examples. |
| runqlen.bt | CPU scheduler run queue length as a histogram. Examples. |
| setuids.bt | Trace the setuid syscalls: privilege escalation. Examples. |
| ssllatency.bt | Summarize SSL/TLS handshake latency as a histogram. Examples. |
| sslsnoop.bt | Trace SSL/TLS handshake, showing latency and return value. Examples. |
| statsnoop.bt | Trace stat() syscalls for general debugging. Examples. |
| swapin.bt | Show swapins by process. Examples. |
| syncsnoop.bt | Trace sync() variety of syscalls. Examples. |
| syscount.bt | Count system calls. Examples. |
| tcpaccept.bt | Trace TCP passive connections (accept()). Examples. |
| tcpconnect.bt | Trace TCP active connections (connect()). Examples. |
| tcpdrop.bt | Trace kernel-based TCP packet drops with details. Examples. |
| tcplife.bt | Trace TCP session lifespans with connection details. Examples. |
| tcpretrans.bt | Trace TCP retransmits. Examples. |
| tcpsynbl.bt | Show TCP SYN backlog as a histogram. Examples. |
| threadsnoop.bt | List new thread creation. Examples. |
| undump.bt | Capture UNIX domain socket packages. Examples. |
| vfscount.bt | Count VFS calls. Examples. |
| vfsstat.bt | Count some VFS calls, with per-second summaries. Examples. |
| writeback.bt | Trace file system writeback events with details. Examples. |
| xfsdist.bt | Summarize XFS operation latency distribution as a histogram. Examples. |
2 - BCC
BCC in short is a toolkit that makes eBPF development easier by providing a higher-level interface. It compiles your eBPF C code at runtime to match the target kernel’s data structures. BCC works with languages like Python, Lua, and C++, and includes helpful macros and shortcuts for simpler programming. Essentially, BCC takes your eBPF program as a C string, preprocesses it, and then compiles it using clang.
The following is a crash course on BCC. I strongly recommend reading the BCC manual as well—it’s incredibly detailed and covers topics that are too extensive for this chapter.
Probes Definition
- kprobe:
kprobe__followed by the name of kernel function name. For example, int kprobe__do_mkdirat(struct pt_regs *ctx). struct pt_regs *ctx as a context for kprobe. Arguments can be extracted using PT_REGS_PARM1(ctx), PT_REGS_PARM2(ctx), … macros. - kretprobe:
kretprobe__followed by the name of kernel function name. For example,int kretprobe__do_mkdirat(struct pt_regs *ctx). Return value can be extracted usingPT_REGS_RC(ctx)macro. - uprobes: Can be declared as regular C function. For example,
int function(struct pt_regs *ctx). Arguments can be extracted using PT_REGS_PARM1(ctx), PT_REGS_PARM2(ctx), … macros. - uretprobes: Can be declared as regular C function
int function(struct pt_regs *ctx). Return value can be extracted usingPT_REGS_RC(ctx)macro. - Tracepoints:
TRACEPOINT_PROBEfollowed by(category, event). For example,TRACEPOINT_PROBE(sched,sched_process_exit). Arguments are available in anargsstruct and you can list of argument from theformatfile. Foe example,args->pathnamein case ofTRACEPOINT_PROBE(syscalls, sys_enter_unlinkat). - Raw Tracepoints:
RAW_TRACEPOINT_PROBE(event).
For example,RAW_TRACEPOINT_PROBE(sys_enter). As stated before, raw tracepoint usesbpf_raw_tracepoint_argsas context and it has args asargs[0]-> points topt_regsstructure andargs[1]is the syscall number. To access the target functions’ parameters, you can either castctx->args[0]to a pointer to astruct pt_regsand use it directly, or copy its contents into a local variable of typestruct pt_regs(e.g.,struct pt_regs regs;). Then, you can extract the syscall parameters using thePT_REGS_PARMmacros (such asPT_REGS_PARM1,PT_REGS_PARM2, etc.).
// Copy the pt_regs structure from the raw tracepoint args.
if (bpf_probe_read(®s, sizeof(regs), (void *)ctx->args[0]) != 0)
return 0;
// Get the second parameter (pathname) from the registers.
const char *pathname = (const char *)PT_REGS_PARM2(®s);
- LSM:
LSM_PROBE(hook_name,typeof(arg1), typeof(arg1)...). For example, to prevent creating a new directory:
LSM_PROBE(path_mkdir, const struct path *dir, struct dentry *dentry, umode_t mode, int ret)
{
    bpf_trace_printk("LSM path_mkdir: mode=%d, ret=%d\n", mode, ret);
    return -1;
}
Data handling
bpf_probe_read_kernelhelper function with the following prototype:
int bpf_probe_read_kernel(void *dst, int size, const void *src)
bpf_probe_read_kernel is used for copying arbitrary data (e.g., structures, buffers) from kernel space and returns 0 on success.
bpf_probe_read_kernel_strhelper function with the following prototype:
int bpf_probe_read_kernel_str(void *dst, int size, const void *src)
bpf_probe_read_kernel_str is used for reading null-terminated strings from kernel space and returns the length of the string including the trailing NULL on success.
bpf_probe_read_userhelper function with the following prototype:
int bpf_probe_read_user(void *dst, int size, const void *src)
bpf_probe_read_user is used for copying arbitrary data (e.g., structures, buffers) from user space and returns 0 on success.
bpf_probe_read_user_strhelper function with the following prototype:
int bpf_probe_read_user_str(void *dst, int size, const void *src)
bpf_probe_read_user_str is used for reading null-terminated strings from user space and returns the length of the string including the trailing NULL on success.
bpf_ktime_get_ns: returnsu64time elapsed since system boot in nanoseconds.bpf_get_current_pid_tgid: returnsu64current tgid and pid.bpf_get_current_uid_gid: returnsu64current pid and gid.bpf_get_current_comm(void *buf, __u32 size_of_buf): copy current process name into pointerbufand sizeof at least 16 bytes. For example:
    char comm[TASK_COMM_LEN]; // TASK_COMM_LEN = 16, defined in include/linux/sched.h
    bpf_get_current_comm(&comm, sizeof(comm));
bpf_get_current_taskhelper function returns current task as a pointer tostruct task_struct.
Buffers
BPF_PERF_OUTPUT(name): creates eBPF table to push data out to user-space using perf buffer.perf_submit: a method of aBPF_PERF_OUTPUTto submit data to user-space. The methodperf_submithas the following prototype:int perf_submit((void *)ctx, (void *)data, u32 data_size).BPF_RINGBUF_OUTPUT: creates eBPF table to push data out to user-space using ring buffer. It has the following prototypeBPF_RINGBUF_OUTPUT(name, page_cnt),page_cntis number of memory pages for ring buffer size.ringbuf_output: a method of theBPF_RINGBUF_OUTPUTto submit data to user-space.ringbuf_outputhas the following prototype:int ringbuf_output((void *)data, u64 data_size, u64 flags).ringbuf_reserve: a method of theBPF_RINGBUF_OUTPUTto reserve a space in ring buffer and allocate data structure pointer for output data. It has the following prototype:void* ringbuf_reserve(u64 data_size).ringbuf_submit: a method of theBPF_RINGBUF_OUTPUTto submit data to user-space.ringbuf_submithas the following prototype:void ringbuf_submit((void *)data, u64 flags).
Maps
BPF_HASH: creates hash map. For example,BPF_HASH(my_hash, u64, u64);.BPF_ARRAY: creates array map.
BCC has also BPF_HISTOGRAM, BPF_STACK_TRACE, BPF_PERF_ARRAY, BPF_PERCPU_HASH, BPF_PERCPU_ARRAY, BPF_LPM_TRIE,BPF_PROG_ARRAY, BPF_CPUMAP, BPF_ARRAY_OF_MAPS and BPF_HASH_OF_MAPS.
Map Operations
*val map.lookup(&key): return a pointer to value if exists.map.delete(&key): delete a key from map.map.update(&key, &val): updates value for a given key.map.insert(&key, &val): inserts a value for a given key.map.increment(key[, increment_amount]): increments the value associated with key byincrement_amount.
BCC Python
BPF(text=prog): creates eBPF object.BPF.attach_kprobe(event="event", fn_name="name"): attach a probe into kernel functioneventand usenameas kprobe handler.BPF.attach_kretprobe(event="event", fn_name="name"): behaves the same way asattach_kprobe.BPF.attach_tracepoint(tp="tracepoint", fn_name="name"): attach a probe intotracepointand usenameas tracepoint handler.BPF.attach_uprobe(name="location", sym="symbol", fn_name="name"): attach a probe tolocationwithsymbolusenameas uprobe handler. For example,
b.attach_uprobe(name="/bin/bash", sym="shell_execve", fn_name="bash_exec")
Attach a probe to shell_execve symbol in binary or object file/bin/bashand use bash_exec as a handler.
BPF.attach_uretprobe(name="location", sym="symbol", fn_name="name"): the same asattach_uprobe.BPF.attach_raw_tracepoint(tp="tracepoint", fn_name="name"): the same asattach_tracepoint.BPF.attach_xdp(dev="device", fn=b.load_func("fn_name",BPF.XDP), flags): attach XDP todevice, usefn_nameas handler for each ingress packet. Flags are defined ininclude/uapi/linux/if_link.has the following:
#define XDP_FLAGS_UPDATE_IF_NOEXIST	(1U << 0) //-->
#define XDP_FLAGS_SKB_MODE		(1U << 1)
#define XDP_FLAGS_DRV_MODE		(1U << 2)
#define XDP_FLAGS_HW_MODE		(1U << 3)
XDP_FLAGS_UPDATE_IF_NOEXIST (1U « 0): This flag attaches the XDP program if there isn’t already one present. XDP_FLAGS_SKB_MODE (1U « 1): This flag attaches the XDP program in generic mode. XDP_FLAGS_DRV_MODE (1U « 2): This flag attaches the XDP program in native driver mode. XDP_FLAGS_HW_MODE (1U « 3): This flag is used for offloading the XDP program to supported hardware (NICs that support XDP offload).
BPF.remove_xdp("device"): removes XDP program from interfacedevice.BPF.detach_kprobe(event="event", fn_name="name"): detach a kprobe.BPF.detach_kretprobe(event="event", fn_name="name"): detach a kretprobe.
Output
BPF.perf_buffer_poll(timeout=T): polls data from perf buffer.BPF.ring_buffer_poll(timeout=T): polls data from ring buffer.table.open_perf_buffer(callback, page_cnt=N, lost_cb=None): opens a perf ring buffer forBPF_PERF_OUTPUT.table.open_ring_buffer(callback, ctx=None): opens a buffer ring specifically forBPF_RINGBUF_OUTPUT.BPF.trace_print: reads from/sys/kernel/debug/tracing/trace_pipeand prints the contents.
Examples
Let’s look at example The following eBPF kernel code yo attack kprobe to do_mkdirat kernel function.
from bcc import BPF

prog = r"""
#include <uapi/linux/ptrace.h>
#include <linux/fs.h>

#define MAX_FILENAME_LEN 256

int kprobe__do_mkdirat(struct pt_regs *ctx)
{
    pid_t pid = bpf_get_current_pid_tgid() >> 32;
    char fname[MAX_FILENAME_LEN] = {};

    struct filename *name = (struct filename *)PT_REGS_PARM2(ctx);
    const char *name_ptr = 0;

    bpf_probe_read(&name_ptr, sizeof(name_ptr), &name->name);

    bpf_probe_read_str(fname, sizeof(fname), name_ptr);

    umode_t mode = PT_REGS_PARM3(ctx);

    bpf_trace_printk("KPROBE ENTRY pid = %d, filename = %s, mode = %u", pid, fname, mode);
    return 0;
}
"""

b = BPF(text=prog)
print("Tracing mkdir calls... Hit Ctrl-C to exit.")
b.trace_print()
bpf_trace_printk function is similar to bpf_printk macro. First, we create an eBPF object from the C code using b = BPF(text=prog). We don’t have to add attach_kprobe because we followed the naming convention of kprobe which is kprobe__ followed by the name of kernel function name kprobe__do_mkdirat.
Run sudo python3 bcc-mkdir.py:
b'  mkdir-1706 [...] KPROBE ENTRY pid = 1706, filename = test1, mode = 511'
b'  mkdir-1708 [...] KPROBE ENTRY pid = 1708, filename = test2, mode = 511'
We don’t have to compile because BCC compiles eBPF C code at runtime and there is no need to write a separate user-space. If you notice, the previous code is exactly similar to the following:
#define __TARGET_ARCH_x86
#include "vmlinux.h"
#include <bpf/bpf_helpers.h>
#include <bpf/bpf_tracing.h>
#include <bpf/bpf_core_read.h>

char LICENSE[] SEC("license") = "GPL";

SEC("kprobe/do_mkdirat")
int kprobe_mkdir(struct pt_regs *ctx)
{
    pid_t pid;
    const char *filename;
    umode_t mode;

    pid = bpf_get_current_pid_tgid() >> 32;
    struct filename *name = (struct filename *)PT_REGS_PARM2(ctx);
    filename = BPF_CORE_READ(name, name);
	mode = PT_REGS_PARM3(ctx);

    bpf_printk("KPROBE ENTRY pid = %d, filename = %s, mode = %u\n", pid, filename,mode);

    return 0;
}
Let’s explore another example which uses Tracepoints with ring buffer map.
from bcc import BPF

prog = """

struct event {
    u32 pid;
    char comm[16];
    char filename[256];
};

BPF_RINGBUF_OUTPUT(events, 4096);

TRACEPOINT_PROBE(syscalls, sys_enter_unlinkat) {
    struct event *evt = events.ringbuf_reserve(sizeof(*evt));
    if (!evt)
        return 0;

    evt->pid = bpf_get_current_pid_tgid() >> 32;
    bpf_get_current_comm(evt->comm, sizeof(evt->comm));
    // In the tracepoint for unlinkat, the second argument (args->pathname) is the filename.
    bpf_probe_read_user_str(evt->filename, sizeof(evt->filename), args->pathname);

    events.ringbuf_submit(evt, 0);
    return 0;
}
"""

def print_event(cpu, data, size):
    event = b["events"].event(data)
    print("PID: %d, COMM: %s, File: %s" %
          (event.pid,
           event.comm.decode('utf-8'),
           event.filename.decode('utf-8')))

b = BPF(text=prog)
b["events"].open_ring_buffer(print_event)

print("Tracing unlinkat syscall... Hit Ctrl-C to end.")
while True:
    try:
        b.ring_buffer_poll(100)
    except KeyboardInterrupt:
        exit()
The print_event callback function to the ring buffer which will be called every time an event is received from the ring buffer. print_event takes cpu number, pointer to raw data of the event data structure defined in eBPF code and size of the event data.
def print_event(cpu, data, size):
Then, event is defined automatically using BCC from eBPF data structure event:
event = b["events"].event(data)
Then, printing out the contents of the event:
print("PID: %d, COMM: %s, File: %s" %
      (event.pid,
      event.comm.decode('utf-8'),
      event.filename.decode('utf-8')))
Then,we create an eBPF object from the C code using b = BPF(text=prog). Then, we opened the ring buffer associated with the map named events with callback function (print_event) to process data that is submitted to the ring buffer.
b["events"].open_ring_buffer(print_event)
We don’t need to use BPF.attach_tracepoint because we followed the naming convention for tracepoints which is TRACEPOINT_PROBE(_category_, _event_). Finally, we start polling from the ring buffer with 100ms timeout.
b.ring_buffer_poll(100) # 100ms timeout
If you noticed, this code is similar to what we did in tracepoint.
#define __TARGET_ARCH_x86
#include "vmlinux.h"
#include <bpf/bpf_helpers.h>
#include <bpf/bpf_tracing.h>
#include <bpf/bpf_core_read.h>

struct event {
    __u32 pid;
    char comm[16];
    char filename[256];
};

struct {
    __uint(type, BPF_MAP_TYPE_RINGBUF);
    __uint(max_entries, 4096);
} events SEC(".maps");

char _license[] SEC("license") = "GPL";

SEC("tracepoint/syscalls/sys_enter_unlinkat")
int trace_unlinkat(struct trace_event_raw_sys_enter* ctx) {
    struct event *evt;

    evt = bpf_ringbuf_reserve(&events, sizeof(struct event), 0);
    if (!evt)
        return 0;

    evt->pid = bpf_get_current_pid_tgid() >> 32;
    bpf_get_current_comm(&evt->comm, sizeof(evt->comm));
    bpf_probe_read_user_str(&evt->filename, sizeof(evt->filename), (const char *)ctx->args[1]);

    bpf_ringbuf_submit(evt, 0);

    return 0;
}
BCC Tools
The following tables are from the BCC GitHub repository. These tables contain useful tools for different aspects of system analysis, including general tracing and debugging, memory and process monitoring, performance and timing, CPU and scheduler statistics, network and socket monitoring, as well as storage and filesystems diagnostics. Each category offers a range of tools designed to help you quickly diagnose issues, tune performance, and gather insights into system behavior using BPF-based instrumentation.
General
| Name | Description |
|---|---|
| argdist | Display function parameter values as a histogram or frequency count. |
| bashreadline | Print entered bash commands system wide. |
| bpflist | Display processes with active BPF programs and maps. |
| capable | Trace security capability checks. |
| compactsnoop | Trace compact zone events with PID and latency. |
| criticalstat | Trace and report long atomic critical sections in the kernel. |
| deadlock | Detect potential deadlocks on a running process. |
| drsnoop | Trace direct reclaim events with PID and latency. |
| funccount | Count kernel function calls. |
| inject | Targeted error injection with call chain and predicates. |
| klockstat | Traces kernel mutex lock events and displays lock statistics. |
| opensnoop | Trace open() syscalls. |
| readahead | Show performance of read-ahead cache. |
| reset-trace | Reset the state of tracing. Maintenance tool only. |
| stackcount | Count kernel function calls and their stack traces. |
| syncsnoop | Trace sync() syscall. |
| threadsnoop | List new thread creation. |
| tplist | Display kernel tracepoints or USDT probes and their formats. |
| trace | Trace arbitrary functions, with filters. |
| ttysnoop | Watch live output from a tty or pts device. |
| ucalls | Summarize method calls or Linux syscalls in high-level languages. |
| uflow | Print a method flow graph in high-level languages. |
| ugc | Trace garbage collection events in high-level languages. |
| uobjnew | Summarize object allocation events by object type and number of bytes allocated. |
| ustat | Collect events such as GCs, thread creations, object allocations, exceptions, etc. |
| uthreads | Trace thread creation events in Java and raw pthreads. |
Memory and Process Tools
| Name | Description |
|---|---|
| execsnoop | Trace new processes via exec() syscalls. |
| exitsnoop | Trace process termination (exit and fatal signals). |
| killsnoop | Trace signals issued by the kill() syscall. |
| kvmexit | Display the exit_reason and its statistics of each vm exit. |
| memleak | Display outstanding memory allocations to find memory leaks. |
| numasched | Track the migration of processes between NUMAs. |
| oomkill | Trace the out-of-memory (OOM) killer. |
| pidpersec | Count new processes (via fork). |
| rdmaucma | Trace RDMA Userspace Connection Manager Access events. |
| shmsnoop | Trace System V shared memory syscalls. |
| slabratetop | Kernel SLAB/SLUB memory cache allocation rate top. |
Performance and Time Tools
| Name | Description |
|---|---|
| dbslower | Trace MySQL/PostgreSQL queries slower than a threshold. |
| dbstat | Summarize MySQL/PostgreSQL query latency as a histogram. |
| funcinterval | Time interval between the same function as a histogram. |
| funclatency | Time functions and show their latency distribution. |
| funcslower | Trace slow kernel or user function calls. |
| hardirqs | Measure hard IRQ (hard interrupt) event time. |
| mysqld_qslower | Trace MySQL server queries slower than a threshold. |
| ppchcalls | Summarize ppc hcall counts and latencies. |
| softirqs | Measure soft IRQ (soft interrupt) event time. |
| syscount | Summarize syscall counts and latencies. |
CPU and Scheduler Tools
| Name | Description |
|---|---|
| cpudist | Summarize on- and off-CPU time per task as a histogram. |
| cpuunclaimed | Sample CPU run queues and calculate unclaimed idle CPU. |
| llcstat | Summarize CPU cache references and misses by process. |
| offcputime | Summarize off-CPU time by kernel stack trace. |
| offwaketime | Summarize blocked time by kernel off-CPU stack and waker stack. |
| profile | Profile CPU usage by sampling stack traces at a timed interval. |
| runqlat | Run queue (scheduler) latency as a histogram. |
| runqlen | Run queue length as a histogram. |
| runqslower | Trace long process scheduling delays. |
| wakeuptime | Summarize sleep-to-wakeup time by waker kernel stack. |
| wqlat | Summarize work waiting latency on workqueue. |
Network and Sockets Tools
| Name | Description |
|---|---|
| gethostlatency | Show latency for getaddrinfo/gethostbyname[2] calls. |
| bindsnoop | Trace IPv4 and IPv6 bind() system calls (bind()). |
| netqtop | Trace and display packets distribution on NIC queues. |
| sofdsnoop | Trace FDs passed through unix sockets. |
| solisten | Trace TCP socket listen. |
| sslsniff | Sniff OpenSSL written and readed data. |
| tcpaccept | Trace TCP passive connections (accept()). |
| tcpconnect | Trace TCP active connections (connect()). |
| tcpconnlat | Trace TCP active connection latency (connect()). |
| tcpdrop | Trace kernel-based TCP packet drops with details. |
| tcplife | Trace TCP sessions and summarize lifespan. |
| tcpretrans | Trace TCP retransmits and TLPs. |
| tcprtt | Trace TCP round trip time. |
| tcpstates | Trace TCP session state changes with durations. |
| tcpsubnet | Summarize and aggregate TCP send by subnet. |
| tcpsynbl | Show TCP SYN backlog. |
| tcptop | Summarize TCP send/recv throughput by host. Top for TCP. |
| tcptracer | Trace TCP established connections (connect(), accept(), close()). |
| tcpcong | Trace TCP socket congestion control status duration. |
Storage and Filesystems Tools
| Name | Description |
|---|---|
| bitesize | Show per process I/O size histogram. |
| cachestat | Trace page cache hit/miss ratio. |
| cachetop | Trace page cache hit/miss ratio by processes. |
| dcsnoop | Trace directory entry cache (dcache) lookups. |
| dcstat | Directory entry cache (dcache) stats. |
| biolatency | Summarize block device I/O latency as a histogram. |
| biotop | Top for disks: Summarize block device I/O by process. |
| biopattern | Identify random/sequential disk access patterns. |
| biosnoop | Trace block device I/O with PID and latency. |
| dirtop | File reads and writes by directory. Top for directories. |
| filelife | Trace the lifespan of short-lived files. |
| filegone | Trace why file gone (deleted or renamed). |
| fileslower | Trace slow synchronous file reads and writes. |
| filetop | File reads and writes by filename and process. Top for files. |
| mdflush | Trace md flush events. |
| mountsnoop | Trace mount and umount syscalls system-wide. |
| virtiostat | Show VIRTIO device IO statistics. |
Filesystems Tools
| Name | Description |
|---|---|
| btrfsdist | Summarize btrfs operation latency distribution as a histogram. |
| btrfsslower | Trace slow btrfs operations. |
| ext4dist | Summarize ext4 operation latency distribution as a histogram. |
| ext4slower | Trace slow ext4 operations. |
| nfsslower | Trace slow NFS operations. |
| nfsdist | Summarize NFS operation latency distribution as a histogram. |
| vfscount | Count VFS calls. |
| vfsstat | Count some VFS calls, with column output. |
| xfsdist | Summarize XFS operation latency distribution as a histogram. |
| xfsslower | Trace slow XFS operations. |
| zfsdist | Summarize ZFS operation latency distribution as a histogram. |
| zfsslower | Trace slow ZFS operations. |
3 - BPFTool
BPFTool is a command-line utility for interacting with eBPF programs and maps in the Linux kernel. It provides a comprehensive set of commands for loading, inspecting, and debugging eBPF objects. With bpftool, users can load compiled eBPF programs into the kernel, attach them to various kernel events or network interfaces, and manage eBPF maps used for storing and sharing data between kernel and user space. It also offers powerful introspection capabilities, allowing users to examine the state of running eBPF programs, including their maps, attached probes, and verifier logs, making it an indispensable tool for eBPF developers and system administrators working with modern Linux observability and networking.
We used many times to generate vmlinux.h header file and the skeleton header files:
sudo bpftool btf dump file /sys/kernel/btf/vmlinux format c > vmlinux.h
sudo bpftool gen skeleton obj_file.o > obj_file.skel.h
Using sudo bpftool -h to show the program’s options:
Usage: bpftool [OPTIONS] OBJECT { COMMAND | help }
       bpftool batch file FILE
       bpftool version

       OBJECT := { prog | map | link | cgroup | perf | net | feature | btf | gen | struct_ops | iter }
       OPTIONS := { {-j|--json} [{-p|--pretty}] | {-d|--debug} |
                    {-V|--version} }
Let’s explore some of these options. First, let’s try the following simple code which count how many times getpid syscall get invoked:
#include <linux/bpf.h>
#include <bpf/bpf_helpers.h>

struct {
    __uint(type, BPF_MAP_TYPE_ARRAY);
    __uint(max_entries, 1);
    __type(key, int);
    __type(value, int);
} count SEC(".maps");

char _license[] SEC("license") = "GPL";

SEC("tracepoint/syscalls/sys_enter_getpid")
int count_getpid(void *ctx)
{
    int key = 0;
    int *value;

    value = bpf_map_lookup_elem(&count, &key);
    if (value)
        (*value)++;
    return 0;
}
User-space code:
#include <stdio.h>
#include <stdlib.h>
#include <unistd.h>
#include <signal.h>
#include <bpf/libbpf.h>
#include "getpid_count.skel.h"

int main(int argc, char **argv)
{
    struct getpid_count *skel;
    int err;

    skel = getpid_count__open();
    if (!skel) {
        fprintf(stderr, "Failed to open BPF skeleton\n");
        return 1;
    }

    err = getpid_count__load(skel);
    if (err) {
        fprintf(stderr, "Failed to load BPF skeleton: %d\n", err);
        goto cleanup;
    }

    err = getpid_count__attach(skel);
    if (err) {
        fprintf(stderr, "Failed to attach BPF skeleton: %d\n", err);
        goto cleanup;
    }

    int map_fd = bpf_map__fd(skel->maps.count);
    if (map_fd < 0) {
        fprintf(stderr, "Failed to get map FD\n");
        goto cleanup;
    }

    printf("BPF program loaded and map updated. Press Ctrl+C to exit.\n");

    while (1) {
        sleep(1);
        int lookup_key = 0;
        int count = 0;
        err = bpf_map__lookup_elem(skel->maps.count,
                                   &lookup_key, sizeof(lookup_key),
                                   &count, sizeof(count), 0);
        if (err == 0) {
            printf("getpid call count: %d\n", count);
        } else {
            fprintf(stderr, "Lookup failed for key %d: %d\n", lookup_key, err);
        }
    }
cleanup:
    getpid_count__destroy(skel);
    return 0;
}
Before compiling and running the code. Run sudo bpftool prog to list all running eBPF programs:
[...]
42: cgroup_device  name sd_devices  tag 2705a24f44b96941  gpl
	loaded_at 2025-03-17T23:38:12-0400  uid 0
	xlated 464B  jited 301B  memlock 4096B
43: cgroup_skb  name sd_fw_egress  tag 6deef7357e7b4530  gpl
	loaded_at 2025-03-17T23:38:12-0400  uid 0
	xlated 64B  jited 67B  memlock 4096B
44: cgroup_skb  name sd_fw_ingress  tag 6deef7357e7b4530  gpl
	loaded_at 2025-03-17T23:38:12-0400  uid 0
	xlated 64B  jited 67B  memlock 4096B
46: cgroup_device  name sd_devices  tag 30c3c39a95291292  gpl
	loaded_at 2025-03-18T00:27:21-0400  uid 0
	xlated 1664B  jited 1027B  memlock 4096B
You will see a list of cgroup programs running by the system. After compiling and running the previous code and then list all running eBPF code sudo bpftool prog:
46: cgroup_device  name sd_devices  tag 30c3c39a95291292  gpl
	loaded_at 2025-03-18T00:27:21-0400  uid 0
	xlated 1664B  jited 1027B  memlock 4096B
312: tracepoint  name count_getpid  tag be075f8b6a94de72  gpl
	loaded_at 2025-03-18T05:38:34-0400  uid 0
	xlated 152B  jited 99B  memlock 4096B  map_ids 147
	btf_id 511
Also --pretty option can be used sudo bpftool prog --pretty to display the output in prettified JSON.
[...]
        "id": 312,
        "type": "tracepoint",
        "name": "count_getpid",
        "tag": "be075f8b6a94de72",
        "gpl_compatible": true,
        "loaded_at": 1742290714,
        "uid": 0,
        "orphaned": false,
        "bytes_xlated": 152,
        "jited": true,
        "bytes_jited": 99,
        "bytes_memlock": 4096,
        "map_ids": [147],
        "btf_id": 511
[...]
Our code has the following properties:
id = 312
Program Type = tracepoint which represents the type of eBPF program
name = count_getpid which is the name of the function defined in the code
tag = be075f8b6a94de72 which is a hash of the compiled instructions.
gpl which is the liscence
loaded_at = 2025-03-18T05:38:34-0400 timestamp when the program was loaded
uid = 0 which indicated that loaded by root
xlated = 152B represents the size of eBPF bytecode
jited = 99B represents the size of the machine code
memlock = 4096B represents the size resrved for this program
map_ids = 147 which is the id of the map loaded in this program
btf_id = 511 which is a unique identifier that the kernel assigns to that block of BTF metadata and can inspect its details using sudo bpftool btf show id 511
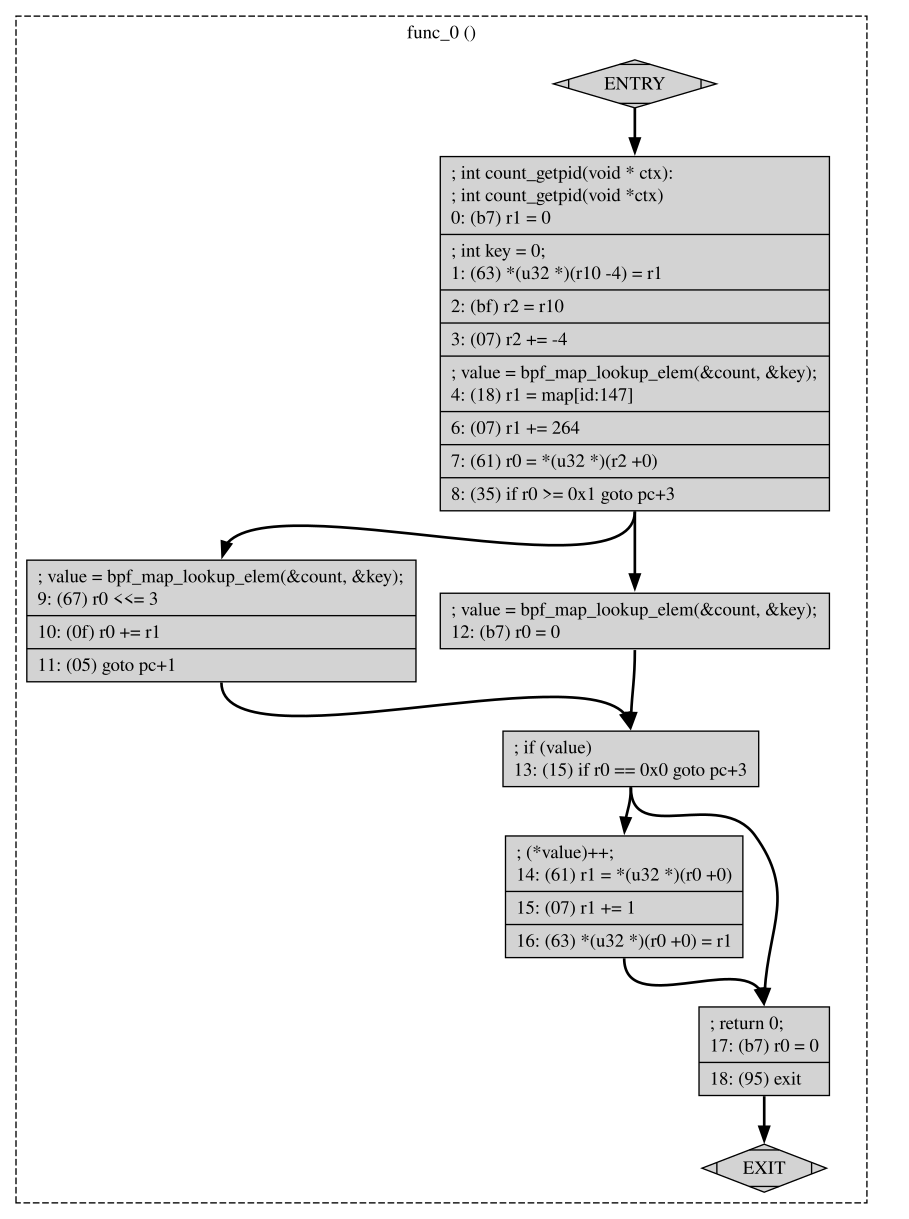
BPFTool can dump eBPF bytecode using sudo bpftool prog dump xlated id 312 :
int count_getpid(void * ctx):
; int count_getpid(void *ctx)
   0: (b7) r1 = 0
; int key = 0;
   1: (63) *(u32 *)(r10 -4) = r1
   2: (bf) r2 = r10
   3: (07) r2 += -4
; value = bpf_map_lookup_elem(&count, &key);
   4: (18) r1 = map[id:147]
   6: (07) r1 += 264
   7: (61) r0 = *(u32 *)(r2 +0)
   8: (35) if r0 >= 0x1 goto pc+3
   9: (67) r0 <<= 3
  10: (0f) r0 += r1
  11: (05) goto pc+1
  12: (b7) r0 = 0
; if (value)
  13: (15) if r0 == 0x0 goto pc+3
; (*value)++;
  14: (61) r1 = *(u32 *)(r0 +0)
  15: (07) r1 += 1
  16: (63) *(u32 *)(r0 +0) = r1
; return 0;
  17: (b7) r0 = 0
  18: (95) exit
We can get visual representation of our code instructions using sudo bpftool prog dump xlated id 312 visual &> vis.out and the output vis.out is a DOT language file which is a graph description language and can be viewed Graphviz. It can be converted to PNG using dot -Tpng viz.out -o viz.png and you can display viz.png file.
BPFTool can also dump jited or the program machine code using sudo bpftool prog dump jited id 312:
int count_getpid(void * ctx):
0xffffffffc03735d4:
; int count_getpid(void *ctx)
   0:	nopl	(%rax,%rax)
   5:	nopl	(%rax)
   8:	pushq	%rbp
   9:	movq	%rsp, %rbp
   c:	subq	$8, %rsp
  13:	xorl	%edi, %edi
; int key = 0;
  15:	movl	%edi, -4(%rbp)
  18:	movq	%rbp, %rsi
  1b:	addq	$-4, %rsi
; value = bpf_map_lookup_elem(&count, &key);
  1f:	movabsq	$-121297335560704, %rdi
  29:	addq	$272, %rdi
  30:	movl	(%rsi), %eax
  33:	cmpq	$1, %rax
  37:	jae	0xffffffffc0373616
  39:	shlq	$3, %rax
  3d:	addq	%rdi, %rax
  40:	jmp	0xffffffffc0373618
  42:	xorl	%eax, %eax
; if (value)
  44:	testq	%rax, %rax
  47:	je	0xffffffffc0373627
; (*value)++;
  49:	movl	(%rax), %edi
  4c:	addq	$1, %rdi
  50:	movl	%edi, (%rax)
; return 0;
  53:	xorl	%eax, %eax
  55:	leave
  56:	jmp	0xffffffff85f0410b
Note
I had to download the source code and compile bpftool to enable JIT disassembly support. I used the commandmake LLVM_CONFIG=$(which llvm-config) CFLAGS_EXTRA="-DENABLE_JIT_DISASM=1" to ensure that LLVM was correctly detected and that JIT disassembly support was enabled.
Note
You can inspect eBPF instructions for the object file usingllvm-objdump -S getpid.o
getpid.o:	file format elf64-bpf

Disassembly of section tracepoint/syscalls/sys_enter_getpid:

0000000000000000 <count_getpid>:
; {
       0:	b7 01 00 00 00 00 00 00	r1 = 0x0
;     int key = 0;
       1:	63 1a fc ff 00 00 00 00	*(u32 *)(r10 - 0x4) = r1
       2:	bf a2 00 00 00 00 00 00	r2 = r10
       3:	07 02 00 00 fc ff ff ff	r2 += -0x4
;     value = bpf_map_lookup_elem(&count, &key);
       4:	18 01 00 00 00 00 00 00 00 00 00 00 00 00 00 00	r1 = 0x0 ll
       6:	85 00 00 00 01 00 00 00	call 0x1
;     if (value)
       7:	15 00 03 00 00 00 00 00	if r0 == 0x0 goto +0x3 <count_getpid+0x58>
;         (*value)++;
       8:	61 01 00 00 00 00 00 00	r1 = *(u32 *)(r0 + 0x0)
       9:	07 01 00 00 01 00 00 00	r1 += 0x1
      10:	63 10 00 00 00 00 00 00	*(u32 *)(r0 + 0x0) = r1
;     return 0;
      11:	b7 00 00 00 00 00 00 00	r0 = 0x0
      12:	95 00 00 00 00 00 00 00	exit
You can find a list of eBPF opcodes from kernel documentation or RFC 9669.
BPFTool can display the list of all maps using sudo bpftool map
11: hash_of_maps  name cgroup_hash  flags 0x0
	key 8B  value 4B  max_entries 2048  memlock 165152B
147: array  name count  flags 0x0
	key 4B  value 4B  max_entries 1  memlock 272B
	btf_id 511
We can also inspect map content with id 147 using sudo bpftool map dump id 147
[{
        "key": 0,
        "value": 22 # count of how many times `getpid` syscall get invoked
    }
]
Maps can be updated using bpftool. For example, let’s change the value to 90 sudo bpftool map update id 147 key 00 00 00 00 value 90 00 00 00 and inspect the content again sudo bpftool map dump id 147 you might see:
[{
        "key": 0,
        "value": 98
    }
]
The extra 8 indicates that between your update and the dump, the getpid syscall was triggered 8 times, and since your eBPF program increments the value each time getpid is called, the counter increased from 90 to 98.
Maps also can be pinned to eBPF filesystem using sudo bpftool map pin id 147 /sys/fs/bpf/getpid_map and even after termination of our program we can dump the content of the pinned map using sudo bpftool map dump pinned /sys/fs/bpf/getpid_map
[{
        "key": 0,
        "value": 122
    }
]
We can unpin simply by remove the created file sudo rm /sys/fs/bpf/getpid_map.
BPFTool can also load programs. Let’s close our program and load it again using:
sudo bpftool prog loadall getpid.o /sys/fs/bpf/test autoattach and then run sudo bpftool prog to make sure that the program is loaded:
741: tracepoint  name count_getpid  tag be075f8b6a94de72  gpl
	loaded_at 2025-03-18T07:03:14-0400  uid 0
	xlated 152B  jited 99B  memlock 4096B  map_ids 85
	btf_id 189
autoattach option is to load, attach and pin kprobe, kretprobe, uprobe, uretprobe and tracepoints in a single command.
We can again dump the content of the program map sudo bpftool map dump id 85
[{
        "key": 0,
        "value": 24
    }
]
BPFTool can also load and attach another types of eBPF programs such as XDP. Let’s see the following code of XDP which drops ingress traffic to port 8080:
#include <linux/bpf.h>
#include <linux/if_ether.h>
#include <linux/ip.h>
#include <linux/tcp.h>
#include <bpf/bpf_helpers.h>
#include <bpf/bpf_endian.h>
#include <linux/in.h>

char _license[] SEC("license") = "GPL";

SEC("xdp")
int drop_ingress_port_8080(struct xdp_md *ctx) {
    void *data = (void *)(long)ctx->data;
    void *data_end = (void *)(long)ctx->data_end;

    struct ethhdr *eth = data;
    if ((void *)eth + sizeof(*eth) > data_end)
        return XDP_PASS;

    if (bpf_ntohs(eth->h_proto) != ETH_P_IP)
        return XDP_PASS;

    struct iphdr *iph = data + sizeof(*eth);
    if ((void *)iph + sizeof(*iph) > data_end)
        return XDP_PASS;

    if (iph->protocol != IPPROTO_TCP)
        return XDP_PASS;

    int ip_header_length = iph->ihl * 4;

    struct tcphdr *tcph = data + sizeof(*eth) + ip_header_length;
    if ((void *)tcph + sizeof(*tcph) > data_end)
        return XDP_PASS;

    if (bpf_ntohs(tcph->dest) == 8080) {
        bpf_printk("Dropping XDP egress packet port 8080\n");
        return XDP_DROP;
    }
    return XDP_PASS;
}
We can load this program using sudo bpftool prog load xdp_drop8080.o /sys/fs/bpf/xdp type xdp. Then running sudo bpftool prog list pinned /sys/fs/bpf/xdp to see if the program is loaded successfully:
835: xdp  name drop_egress_port_8080  tag 7c15f4a6de3ceb0f  gpl
	loaded_at 2025-03-18T07:24:28-0400  uid 0
	xlated 248B  jited 164B  memlock 4096B  map_ids 122
	btf_id 310
Then we can attach this program to an interface sudo bpftool net attach xdp id 835 dev enp1s0. To confirm program is attached use sudo bpftool net list:
xdp:
enp1s0(2) driver id 835

tc:

flow_dissector:

netfilter:
Or by viewing ip a:
2: enp1s0: <BROADCAST,MULTICAST,UP,LOWER_UP> mtu 1500 xdp/id:835 qdisc fq_codel state UP group default qlen 1000
    link/ether 52:54:00:f6:fe:bc brd ff:ff:ff:ff:ff:ff
    altname enx525400f6febc
    inet 192.168.1.238/24 brd 192.168.1.255 scope global dynamic noprefixroute enp1s0
       valid_lft 3543sec preferred_lft 3543sec
    inet6 fe80::5054:ff:fef6:febc/64 scope link noprefixroute
       valid_lft forever preferred_lft forever
We can see xdp/id:835 which confirms program with id 835 of type XDP is attached to enp1s0 interface. Use sudo bpftool net detach xdp dev enp1s0 to detach the XDP program.
Unloading eBPF program can be done by removing the pinned pseudofile. For example, sudo rm /sys/fs/bpf/xdp to unload the XDP program. We can also use bpftool to load and attached TC programs with tcx_egress for egress traffic and tcx_ingress for ingress traffic. For example, sudo bpftool net attach tcx_egress id 423 dev enp1s0.
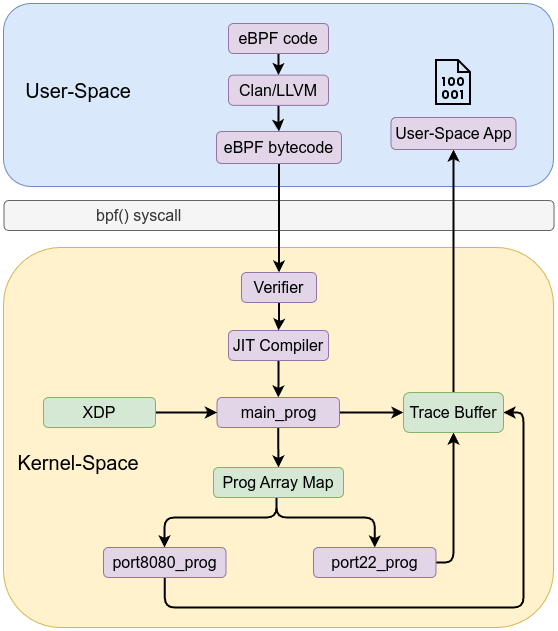
4 - Tail call
Tail calls in eBPF let you chain together multiple BPF programs, effectively bypassing the instruction limit imposed on individual programs which is around 4096 instructions before kernel 5.2 and now the limit is one million instructions. Tail calls can also be used to break up the code logic into multiple parts to enable modular design. Tail call transfers control from one eBPF program to another without returning to the caller. 1. The verifier ensures that tail calls do not lead to unbounded recursion and that the jump is safe. It also reduces the effective stack size available (e.g., from 512 bytes to 256 bytes) when tail calls are used with BPF-to-BPF function calls.
How Tail Calls Work
- eBPF uses a special map type called
BPF_MAP_TYPE_PROG_ARRAYthat holds file descriptors of other BPF programs. The tail call uses an index (or key) into this map to know which program to jump to. - Within an eBPF program, you can use the helper function
bpf_tail_call(ctx, prog_array, key)to transfer execution to another program. If the call is successful, the current program’s execution ends and the new program starts from its entry point.
Let’s explore an example of XDP code. The idea is to have a main XDP program that inspects incoming packets and, based on the TCP destination port, uses a tail call to jump to the appropriate program—one for port 8080 and one for port 22.
#include <linux/bpf.h>
#include <bpf/bpf_helpers.h>
#include <bpf/bpf_endian.h>
#include <linux/if_ether.h>
#include <linux/ip.h>
#include <linux/tcp.h>
#include <linux/in.h>

struct {
    __uint(type, BPF_MAP_TYPE_PROG_ARRAY);
    __uint(max_entries, 2);
    __uint(key_size, sizeof(int));
    __uint(value_size, sizeof(int));
} prog_array SEC(".maps");

char _license[] SEC("license") = "GPL";

SEC("xdp")
int main_prog(struct xdp_md *ctx)
{
    void *data = (void *)(long)ctx->data;
    void *data_end = (void *)(long)ctx->data_end;
    struct ethhdr *eth = data;
    struct iphdr *iph;
    struct tcphdr *tcph;

    if (data + sizeof(*eth) > data_end)
        return XDP_ABORTED;

    if (eth->h_proto != bpf_htons(ETH_P_IP))
        return XDP_PASS;

    iph = data + sizeof(*eth);
    if ((void *)iph + sizeof(*iph) > data_end)
        return XDP_ABORTED;

    if (iph->protocol != IPPROTO_TCP)
        return XDP_PASS;

    tcph = (void *)iph + (iph->ihl * 4);
    if ((void *)tcph + sizeof(*tcph) > data_end)
        return XDP_ABORTED;

    int dport = bpf_ntohs(tcph->dest);

    if (dport == 8080) {
        int key = 0;
        bpf_tail_call(ctx, &prog_array, key);
    } else if (dport == 22) {
        int key = 1;
        bpf_tail_call(ctx, &prog_array, key);
    }

    return XDP_PASS;
}

SEC("xdp")
int port8080_prog(struct xdp_md *ctx)
{
    bpf_printk("Packet to port 8080 processed\n");
    return XDP_PASS;
}

SEC("xdp")
int port22_prog(struct xdp_md *ctx)
{
    bpf_printk("Packet to port 22 processed\n");
    return XDP_PASS;
}
User-space code:
#include <stdio.h>
#include <stdlib.h>
#include <unistd.h>
#include <errno.h>
#include <net/if.h>
#include <bpf/libbpf.h>
#include "tail_call.skel.h"

#ifndef libbpf_is_err
#define libbpf_is_err(ptr) ((unsigned long)(ptr) > (unsigned long)-1000L)
#endif

int main(int argc, char **argv)
{
    struct tail_call *skel;
    struct bpf_link *link = NULL;
    int err, key, prog_fd;
    int ifindex;
    const char *ifname;

    if (argc < 2) {
        fprintf(stderr, "Usage: %s <interface>\n", argv[0]);
        return 1;
    }
    ifname = argv[1];

    skel = tail_call__open();
    if (!skel) {
        fprintf(stderr, "Failed to open BPF skeleton\n");
        return 1;
    }

    err = tail_call__load(skel);
    if (err) {
        fprintf(stderr, "Failed to load BPF skeleton: %d\n", err);
        goto cleanup;
    }

    key = 0;
    prog_fd = bpf_program__fd(skel->progs.port8080_prog);
    if (prog_fd < 0) {
        fprintf(stderr, "Invalid FD for port8080_prog\n");
        goto cleanup;
    }
    err = bpf_map__update_elem(skel->maps.prog_array,
                               &key, sizeof(key),
                               &prog_fd, sizeof(prog_fd),
                               0);
    if (err) {
        fprintf(stderr, "Failed to update prog_array for port8080_prog: %d\n", err);
        goto cleanup;
    }

    key = 1;
    prog_fd = bpf_program__fd(skel->progs.port22_prog);
    if (prog_fd < 0) {
        fprintf(stderr, "Invalid FD for port22_prog\n");
        goto cleanup;
    }
    err = bpf_map__update_elem(skel->maps.prog_array,
                               &key, sizeof(key),
                               &prog_fd, sizeof(prog_fd),
                               0);
    if (err) {
        fprintf(stderr, "Failed to update prog_array for port22_prog: %d\n", err);
        goto cleanup;
    }

    ifindex = if_nametoindex(ifname);
    if (!ifindex) {
        perror("if_nametoindex");
        goto cleanup;
    }

    link = bpf_program__attach_xdp(skel->progs.main_prog, ifindex);
    if (libbpf_is_err(link)) {
        err = libbpf_get_error(link);
        fprintf(stderr, "Failed to attach XDP program on %s (ifindex: %d): %d\n",
                ifname, ifindex, err);
        link = NULL;
        goto cleanup;
    }

    printf("XDP program loaded and tail calls configured on interface %s (ifindex: %d).\n",
           ifname, ifindex);
    printf("Press Ctrl+C to exit...\n");

    while (1)
        sleep(1);

cleanup:
    if (link)
        bpf_link__destroy(link);
    tail_call__destroy(skel);
    return err < 0 ? -err : 0;
}
Compile the code
clang -g -O2 -target bpf -c tail_call.c -o tail_call.o
sudo bpftool gen skeleton tail_call.o > tail_call.skel.h
clang -o loader loader.c -lbpf
Run the loader using sudo ./loader enp1s0 . Open trace buffer sudo cat /sys/kernel/debug/tracing/trace_pipe:
<idle>-0             [003] ..s2.  8853.538349: bpf_trace_printk: Packet to port 8080 processed
<idle>-0             [003] .Ns2.  8853.539270: bpf_trace_printk: Packet to port 8080 processed
<idle>-0             [003] .Ns2.  8853.539279: bpf_trace_printk: Packet to port 8080 processed
gnome-shell-2539     [003] ..s1.  8853.541321: bpf_trace_printk: Packet to port 8080 processed
gnome-shell-2539     [003] ..s1.  8853.541334: bpf_trace_printk: Packet to port 8080 processed
<idle>-0             [003] ..s2.  8860.777125: bpf_trace_printk: Packet to port 22 processed
<idle>-0             [003] ..s2.  8860.777420: bpf_trace_printk: Packet to port 22 processed
<idle>-0             [003] ..s2.  8860.777611: bpf_trace_printk: Packet to port 22 processed
llvmpipe-1-2569      [003] ..s1.  8860.783551: bpf_trace_printk: Packet to port 22 processed