BPFTool
BPFTool is a command-line utility for interacting with eBPF programs and maps in the Linux kernel. It provides a comprehensive set of commands for loading, inspecting, and debugging eBPF objects. With bpftool, users can load compiled eBPF programs into the kernel, attach them to various kernel events or network interfaces, and manage eBPF maps used for storing and sharing data between kernel and user space. It also offers powerful introspection capabilities, allowing users to examine the state of running eBPF programs, including their maps, attached probes, and verifier logs, making it an indispensable tool for eBPF developers and system administrators working with modern Linux observability and networking.
We used many times to generate vmlinux.h header file and the skeleton header files:
sudo bpftool btf dump file /sys/kernel/btf/vmlinux format c > vmlinux.h
sudo bpftool gen skeleton obj_file.o > obj_file.skel.h
Using sudo bpftool -h to show the program’s options:
Usage: bpftool [OPTIONS] OBJECT { COMMAND | help }
       bpftool batch file FILE
       bpftool version

       OBJECT := { prog | map | link | cgroup | perf | net | feature | btf | gen | struct_ops | iter }
       OPTIONS := { {-j|--json} [{-p|--pretty}] | {-d|--debug} |
                    {-V|--version} }
Let’s explore some of these options. First, let’s try the following simple code which count how many times getpid syscall get invoked:
#include <linux/bpf.h>
#include <bpf/bpf_helpers.h>

struct {
    __uint(type, BPF_MAP_TYPE_ARRAY);
    __uint(max_entries, 1);
    __type(key, int);
    __type(value, int);
} count SEC(".maps");

char _license[] SEC("license") = "GPL";

SEC("tracepoint/syscalls/sys_enter_getpid")
int count_getpid(void *ctx)
{
    int key = 0;
    int *value;

    value = bpf_map_lookup_elem(&count, &key);
    if (value)
        (*value)++;
    return 0;
}
User-space code:
#include <stdio.h>
#include <stdlib.h>
#include <unistd.h>
#include <signal.h>
#include <bpf/libbpf.h>
#include "getpid_count.skel.h"

int main(int argc, char **argv)
{
    struct getpid_count *skel;
    int err;

    skel = getpid_count__open();
    if (!skel) {
        fprintf(stderr, "Failed to open BPF skeleton\n");
        return 1;
    }

    err = getpid_count__load(skel);
    if (err) {
        fprintf(stderr, "Failed to load BPF skeleton: %d\n", err);
        goto cleanup;
    }

    err = getpid_count__attach(skel);
    if (err) {
        fprintf(stderr, "Failed to attach BPF skeleton: %d\n", err);
        goto cleanup;
    }

    int map_fd = bpf_map__fd(skel->maps.count);
    if (map_fd < 0) {
        fprintf(stderr, "Failed to get map FD\n");
        goto cleanup;
    }

    printf("BPF program loaded and map updated. Press Ctrl+C to exit.\n");

    while (1) {
        sleep(1);
        int lookup_key = 0;
        int count = 0;
        err = bpf_map__lookup_elem(skel->maps.count,
                                   &lookup_key, sizeof(lookup_key),
                                   &count, sizeof(count), 0);
        if (err == 0) {
            printf("getpid call count: %d\n", count);
        } else {
            fprintf(stderr, "Lookup failed for key %d: %d\n", lookup_key, err);
        }
    }
cleanup:
    getpid_count__destroy(skel);
    return 0;
}
Before compiling and running the code. Run sudo bpftool prog to list all running eBPF programs:
[...]
42: cgroup_device  name sd_devices  tag 2705a24f44b96941  gpl
	loaded_at 2025-03-17T23:38:12-0400  uid 0
	xlated 464B  jited 301B  memlock 4096B
43: cgroup_skb  name sd_fw_egress  tag 6deef7357e7b4530  gpl
	loaded_at 2025-03-17T23:38:12-0400  uid 0
	xlated 64B  jited 67B  memlock 4096B
44: cgroup_skb  name sd_fw_ingress  tag 6deef7357e7b4530  gpl
	loaded_at 2025-03-17T23:38:12-0400  uid 0
	xlated 64B  jited 67B  memlock 4096B
46: cgroup_device  name sd_devices  tag 30c3c39a95291292  gpl
	loaded_at 2025-03-18T00:27:21-0400  uid 0
	xlated 1664B  jited 1027B  memlock 4096B
You will see a list of cgroup programs running by the system. After compiling and running the previous code and then list all running eBPF code sudo bpftool prog:
46: cgroup_device  name sd_devices  tag 30c3c39a95291292  gpl
	loaded_at 2025-03-18T00:27:21-0400  uid 0
	xlated 1664B  jited 1027B  memlock 4096B
312: tracepoint  name count_getpid  tag be075f8b6a94de72  gpl
	loaded_at 2025-03-18T05:38:34-0400  uid 0
	xlated 152B  jited 99B  memlock 4096B  map_ids 147
	btf_id 511
Also --pretty option can be used sudo bpftool prog --pretty to display the output in prettified JSON.
[...]
        "id": 312,
        "type": "tracepoint",
        "name": "count_getpid",
        "tag": "be075f8b6a94de72",
        "gpl_compatible": true,
        "loaded_at": 1742290714,
        "uid": 0,
        "orphaned": false,
        "bytes_xlated": 152,
        "jited": true,
        "bytes_jited": 99,
        "bytes_memlock": 4096,
        "map_ids": [147],
        "btf_id": 511
[...]
Our code has the following properties:
id = 312
Program Type = tracepoint which represents the type of eBPF program
name = count_getpid which is the name of the function defined in the code
tag = be075f8b6a94de72 which is a hash of the compiled instructions.
gpl which is the liscence
loaded_at = 2025-03-18T05:38:34-0400 timestamp when the program was loaded
uid = 0 which indicated that loaded by root
xlated = 152B represents the size of eBPF bytecode
jited = 99B represents the size of the machine code
memlock = 4096B represents the size resrved for this program
map_ids = 147 which is the id of the map loaded in this program
btf_id = 511 which is a unique identifier that the kernel assigns to that block of BTF metadata and can inspect its details using sudo bpftool btf show id 511
BPFTool can dump eBPF bytecode using sudo bpftool prog dump xlated id 312 :
int count_getpid(void * ctx):
; int count_getpid(void *ctx)
   0: (b7) r1 = 0
; int key = 0;
   1: (63) *(u32 *)(r10 -4) = r1
   2: (bf) r2 = r10
   3: (07) r2 += -4
; value = bpf_map_lookup_elem(&count, &key);
   4: (18) r1 = map[id:147]
   6: (07) r1 += 264
   7: (61) r0 = *(u32 *)(r2 +0)
   8: (35) if r0 >= 0x1 goto pc+3
   9: (67) r0 <<= 3
  10: (0f) r0 += r1
  11: (05) goto pc+1
  12: (b7) r0 = 0
; if (value)
  13: (15) if r0 == 0x0 goto pc+3
; (*value)++;
  14: (61) r1 = *(u32 *)(r0 +0)
  15: (07) r1 += 1
  16: (63) *(u32 *)(r0 +0) = r1
; return 0;
  17: (b7) r0 = 0
  18: (95) exit
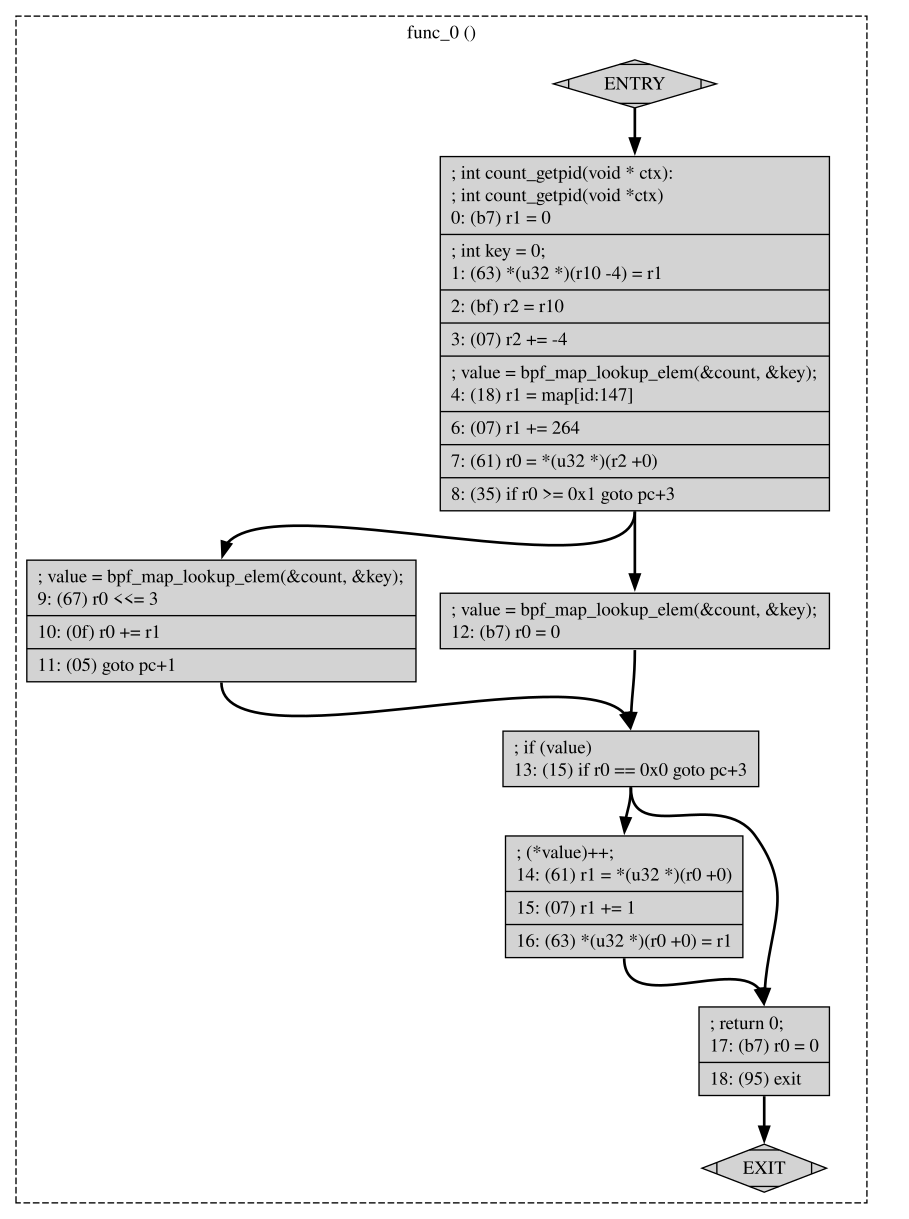
We can get visual representation of our code instructions using sudo bpftool prog dump xlated id 312 visual &> vis.out and the output vis.out is a DOT language file which is a graph description language and can be viewed Graphviz. It can be converted to PNG using dot -Tpng viz.out -o viz.png and you can display viz.png file.
BPFTool can also dump jited or the program machine code using sudo bpftool prog dump jited id 312:
int count_getpid(void * ctx):
0xffffffffc03735d4:
; int count_getpid(void *ctx)
   0:	nopl	(%rax,%rax)
   5:	nopl	(%rax)
   8:	pushq	%rbp
   9:	movq	%rsp, %rbp
   c:	subq	$8, %rsp
  13:	xorl	%edi, %edi
; int key = 0;
  15:	movl	%edi, -4(%rbp)
  18:	movq	%rbp, %rsi
  1b:	addq	$-4, %rsi
; value = bpf_map_lookup_elem(&count, &key);
  1f:	movabsq	$-121297335560704, %rdi
  29:	addq	$272, %rdi
  30:	movl	(%rsi), %eax
  33:	cmpq	$1, %rax
  37:	jae	0xffffffffc0373616
  39:	shlq	$3, %rax
  3d:	addq	%rdi, %rax
  40:	jmp	0xffffffffc0373618
  42:	xorl	%eax, %eax
; if (value)
  44:	testq	%rax, %rax
  47:	je	0xffffffffc0373627
; (*value)++;
  49:	movl	(%rax), %edi
  4c:	addq	$1, %rdi
  50:	movl	%edi, (%rax)
; return 0;
  53:	xorl	%eax, %eax
  55:	leave
  56:	jmp	0xffffffff85f0410b
Note
I had to download the source code and compile bpftool to enable JIT disassembly support. I used the commandmake LLVM_CONFIG=$(which llvm-config) CFLAGS_EXTRA="-DENABLE_JIT_DISASM=1" to ensure that LLVM was correctly detected and that JIT disassembly support was enabled.
Note
You can inspect eBPF instructions for the object file usingllvm-objdump -S getpid.o
getpid.o:	file format elf64-bpf

Disassembly of section tracepoint/syscalls/sys_enter_getpid:

0000000000000000 <count_getpid>:
; {
       0:	b7 01 00 00 00 00 00 00	r1 = 0x0
;     int key = 0;
       1:	63 1a fc ff 00 00 00 00	*(u32 *)(r10 - 0x4) = r1
       2:	bf a2 00 00 00 00 00 00	r2 = r10
       3:	07 02 00 00 fc ff ff ff	r2 += -0x4
;     value = bpf_map_lookup_elem(&count, &key);
       4:	18 01 00 00 00 00 00 00 00 00 00 00 00 00 00 00	r1 = 0x0 ll
       6:	85 00 00 00 01 00 00 00	call 0x1
;     if (value)
       7:	15 00 03 00 00 00 00 00	if r0 == 0x0 goto +0x3 <count_getpid+0x58>
;         (*value)++;
       8:	61 01 00 00 00 00 00 00	r1 = *(u32 *)(r0 + 0x0)
       9:	07 01 00 00 01 00 00 00	r1 += 0x1
      10:	63 10 00 00 00 00 00 00	*(u32 *)(r0 + 0x0) = r1
;     return 0;
      11:	b7 00 00 00 00 00 00 00	r0 = 0x0
      12:	95 00 00 00 00 00 00 00	exit
You can find a list of eBPF opcodes from kernel documentation or RFC 9669.
BPFTool can display the list of all maps using sudo bpftool map
11: hash_of_maps  name cgroup_hash  flags 0x0
	key 8B  value 4B  max_entries 2048  memlock 165152B
147: array  name count  flags 0x0
	key 4B  value 4B  max_entries 1  memlock 272B
	btf_id 511
We can also inspect map content with id 147 using sudo bpftool map dump id 147
[{
        "key": 0,
        "value": 22 # count of how many times `getpid` syscall get invoked
    }
]
Maps can be updated using bpftool. For example, let’s change the value to 90 sudo bpftool map update id 147 key 00 00 00 00 value 90 00 00 00 and inspect the content again sudo bpftool map dump id 147 you might see:
[{
        "key": 0,
        "value": 98
    }
]
The extra 8 indicates that between your update and the dump, the getpid syscall was triggered 8 times, and since your eBPF program increments the value each time getpid is called, the counter increased from 90 to 98.
Maps also can be pinned to eBPF filesystem using sudo bpftool map pin id 147 /sys/fs/bpf/getpid_map and even after termination of our program we can dump the content of the pinned map using sudo bpftool map dump pinned /sys/fs/bpf/getpid_map
[{
        "key": 0,
        "value": 122
    }
]
We can unpin simply by remove the created file sudo rm /sys/fs/bpf/getpid_map.
BPFTool can also load programs. Let’s close our program and load it again using:
sudo bpftool prog loadall getpid.o /sys/fs/bpf/test autoattach and then run sudo bpftool prog to make sure that the program is loaded:
741: tracepoint  name count_getpid  tag be075f8b6a94de72  gpl
	loaded_at 2025-03-18T07:03:14-0400  uid 0
	xlated 152B  jited 99B  memlock 4096B  map_ids 85
	btf_id 189
autoattach option is to load, attach and pin kprobe, kretprobe, uprobe, uretprobe and tracepoints in a single command.
We can again dump the content of the program map sudo bpftool map dump id 85
[{
        "key": 0,
        "value": 24
    }
]
BPFTool can also load and attach another types of eBPF programs such as XDP. Let’s see the following code of XDP which drops ingress traffic to port 8080:
#include <linux/bpf.h>
#include <linux/if_ether.h>
#include <linux/ip.h>
#include <linux/tcp.h>
#include <bpf/bpf_helpers.h>
#include <bpf/bpf_endian.h>
#include <linux/in.h>

char _license[] SEC("license") = "GPL";

SEC("xdp")
int drop_ingress_port_8080(struct xdp_md *ctx) {
    void *data = (void *)(long)ctx->data;
    void *data_end = (void *)(long)ctx->data_end;

    struct ethhdr *eth = data;
    if ((void *)eth + sizeof(*eth) > data_end)
        return XDP_PASS;

    if (bpf_ntohs(eth->h_proto) != ETH_P_IP)
        return XDP_PASS;

    struct iphdr *iph = data + sizeof(*eth);
    if ((void *)iph + sizeof(*iph) > data_end)
        return XDP_PASS;

    if (iph->protocol != IPPROTO_TCP)
        return XDP_PASS;

    int ip_header_length = iph->ihl * 4;

    struct tcphdr *tcph = data + sizeof(*eth) + ip_header_length;
    if ((void *)tcph + sizeof(*tcph) > data_end)
        return XDP_PASS;

    if (bpf_ntohs(tcph->dest) == 8080) {
        bpf_printk("Dropping XDP egress packet port 8080\n");
        return XDP_DROP;
    }
    return XDP_PASS;
}
We can load this program using sudo bpftool prog load xdp_drop8080.o /sys/fs/bpf/xdp type xdp. Then running sudo bpftool prog list pinned /sys/fs/bpf/xdp to see if the program is loaded successfully:
835: xdp  name drop_egress_port_8080  tag 7c15f4a6de3ceb0f  gpl
	loaded_at 2025-03-18T07:24:28-0400  uid 0
	xlated 248B  jited 164B  memlock 4096B  map_ids 122
	btf_id 310
Then we can attach this program to an interface sudo bpftool net attach xdp id 835 dev enp1s0. To confirm program is attached use sudo bpftool net list:
xdp:
enp1s0(2) driver id 835

tc:

flow_dissector:

netfilter:
Or by viewing ip a:
2: enp1s0: <BROADCAST,MULTICAST,UP,LOWER_UP> mtu 1500 xdp/id:835 qdisc fq_codel state UP group default qlen 1000
    link/ether 52:54:00:f6:fe:bc brd ff:ff:ff:ff:ff:ff
    altname enx525400f6febc
    inet 192.168.1.238/24 brd 192.168.1.255 scope global dynamic noprefixroute enp1s0
       valid_lft 3543sec preferred_lft 3543sec
    inet6 fe80::5054:ff:fef6:febc/64 scope link noprefixroute
       valid_lft forever preferred_lft forever
We can see xdp/id:835 which confirms program with id 835 of type XDP is attached to enp1s0 interface. Use sudo bpftool net detach xdp dev enp1s0 to detach the XDP program.
Unloading eBPF program can be done by removing the pinned pseudofile. For example, sudo rm /sys/fs/bpf/xdp to unload the XDP program. We can also use bpftool to load and attached TC programs with tcx_egress for egress traffic and tcx_ingress for ingress traffic. For example, sudo bpftool net attach tcx_egress id 423 dev enp1s0.