Tracepoints
Tracepoints are static instrumentation points compiled into the kernel at code locations chosen by kernel developers. They are placed in meaningful logical places in the code—such as the allocation of memory, the scheduling of tasks, or network packet events—so that when enabled, they can provide consistent and stable data about kernel events. Unlike kprobes, which dynamically instrument arbitrary functions at runtime, tracepoints are predefined by the kernel and remain stable across kernel versions. This makes them a preferred interface whenever a suitable tracepoint is available for the event you are interested in. Tracepoint eBPF programs are classified under the program type BPF_PROG_TYPE_TRACEPOINT.
How Tracepoints Work Under the Hood
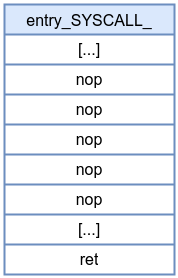
- At compile time, each tracepoint location in the kernel is reserved with a 5-byte NOP (on x86_64).
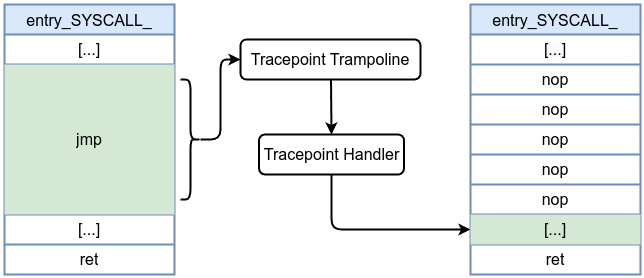
- At runtime, if a tracepoint is enabled, the 5-byte NOP is patched into a 5-byte jump to the trampoline.
- When the tracepoint is disabled (or the last callback is removed), the jump is reverted back to NOP, keeping overhead minimal.
Disabled tracepoint
Enabled tracepoint:
To list all available tracepoints in a Linux system, you can use either sudo bpftrace -l 'tracepoint:*' or sudo ls /sys/kernel/debug/tracing/events/ directory or /sys/kernel/tracing/available_events file which contains a list of all available tracepoints on the system. The SEC name usually follows the format tracepoint__<category>__<name>, for example, SEC("tracepoint/syscalls/sys_enter_unlinkat"). Similarly, the context structure for tracepoints typically follows the naming convention trace_event_raw_<name> (e.g., trace_event_raw_sys_enter and trace_event_raw_sys_exit).
However, there are exceptions. For instance, in the libbpf-bootstrap example, you’ll find:
SEC("tp/sched/sched_process_exit")
int handle_exit(struct trace_event_raw_sched_process_template *ctx)
Here, the context name should be trace_event_raw_sched_process_exit rather than trace_event_raw_sched_process_template. You can verify the correct context by checking the vmlinux.h file.
Let’s explore one of the defined tracepoints from the kernel source code include/trace/events/net.h:
DECLARE_EVENT_CLASS(net_dev_template,
	TP_PROTO(struct sk_buff *skb),
	TP_ARGS(skb),
	TP_STRUCT__entry(
		__field(	void *,		skbaddr		)
		__field(	unsigned int,	len		)
		__string(	name,		skb->dev->name	)
	),
	TP_fast_assign(
		__entry->skbaddr = skb;
		__entry->len = skb->len;
		__assign_str(name);
	),
	TP_printk("dev=%s skbaddr=%p len=%u",
		__get_str(name), __entry->skbaddr, __entry->len)
)
DEFINE_EVENT(net_dev_template, net_dev_queue,
	TP_PROTO(struct sk_buff *skb),
	TP_ARGS(skb)
);
DEFINE_EVENT(net_dev_template, netif_receive_skb,
	TP_PROTO(struct sk_buff *skb),
	TP_ARGS(skb)
);
DEFINE_EVENT(net_dev_template, netif_rx,
	TP_PROTO(struct sk_buff *skb),
	TP_ARGS(skb)
);
Tracepoints are defined using macros like DECLARE_EVENT_CLASS and DEFINE_EVENT. For example, netif_rx is defined as a trace event that logs information about received packets.
DEFINE_EVENT(net_dev_template, netif_rx,
	TP_PROTO(struct sk_buff *skb),
	TP_ARGS(skb)
);
In net/core/dev.c, inside the netif_rx_internal() function:
static int netif_rx_internal(struct sk_buff *skb)
{
	int ret;
	net_timestamp_check(READ_ONCE(net_hotdata.tstamp_prequeue), skb);
	trace_netif_rx(skb);
#ifdef CONFIG_RPS
	if (static_branch_unlikely(&rps_needed)) {
		struct rps_dev_flow voidflow, *rflow = &voidflow;
		int cpu;
		rcu_read_lock();

		cpu = get_rps_cpu(skb->dev, skb, &rflow);
		if (cpu < 0)
			cpu = smp_processor_id();
		ret = enqueue_to_backlog(skb, cpu, &rflow->last_qtail);
		rcu_read_unlock();

	[...]
You can see trace_netif_rx(skb);. This call triggers the tracepoint event for packet reception which logs the event if tracing is enabled.
Then by running gdb /usr/lib/debug/boot/vmlinux-$(uname -r)
(gdb) disassemble netif_rx_internal
Dump of assembler code for function netif_rx_internal:
   0xffffffff81a23d70 <+0>:	call   0xffffffff8108d360 <__fentry__>
   0xffffffff81a23d75 <+5>:	push   %rbx
   0xffffffff81a23d76 <+6>:	sub    $0x18,%rsp
   0xffffffff81a23d7a <+10>:	mov    %gs:0x28,%rbx
   0xffffffff81a23d83 <+19>:	mov    %rbx,0x10(%rsp)
   0xffffffff81a23d88 <+24>:	mov    %rdi,%rbx
   0xffffffff81a23d8b <+27>:	xchg   %ax,%ax
   0xffffffff81a23d8d <+29>:	nopl   0x0(%rax,%rax,1)
   0xffffffff81a23d92 <+34>:	xchg   %ax,%ax
   0xffffffff81a23d94 <+36>:	mov    %gs:0x7e611471(%rip),%esi        # 0x3520c <pcpu_hot+12>
   0xffffffff81a23d9b <+43>:	mov    %rbx,%rdi
   0xffffffff81a23d9e <+46>:	lea    0x8(%rsp),%rdx
   0xffffffff81a23da3 <+51>:	call   0xffffffff81a239e0 <enqueue_to_backlog>
   0xffffffff81a23da8 <+56>:	mov    %eax,%ebx
[...]
The disassembly confirms that at address <+29> you see a reserved 5-byte NOP (shown as nopl 0x0(%rax,%rax,1)). This placeholder is exactly what the kernel uses for its dynamic patching mechanism—when the tracepoint (or static call) is enabled, that NOP will be patched into a jump to the corresponding trampoline (and ultimately to the tracepoint handler).
In the next example, we will examine unlinkat syscall entry point (which removes a directory entry relative to a directory file descriptor) with context trace_event_raw_sys_enter , but what exactly is the content of struct trace_event_raw_sys_enter. We can get the content by searching the vmlinux.h
struct trace_event_raw_sys_enter {
	struct trace_entry ent;
	long int id;
	long unsigned int args[6];
	char __data[0];
};
Using trace_event_raw_sys_enter as context supports BTF. You can also define the context by using the old approach by defining a structure matching the same parameters defined in the format file. For example, for the unlinkat syscall, this file is located at /sys/kernel/debug/tracing/events/syscalls/sys_enter_unlinkat/format which has the following content
name: sys_enter_unlinkat
ID: 849
format:
	field:unsigned short common_type;	offset:0;	size:2;	signed:0;
	field:unsigned char common_flags;	offset:2;	size:1;	signed:0;
	field:unsigned char common_preempt_count;	offset:3;	size:1;	signed:0;
	field:int common_pid;	offset:4;	size:4;	signed:1;

	field:int __syscall_nr;	offset:8;	size:4;	signed:1;
	field:int dfd;	offset:16;	size:8;	signed:0;
	field:const char * pathname;	offset:24;	size:8;	signed:0;
	field:int flag;	offset:32;	size:8;	signed:0;

print fmt: "dfd: 0x%08lx, pathname: 0x%08lx, flag: 0x%08lx", ((unsigned long)(REC->dfd)), ((unsigned long)(REC->pathname)), ((unsigned long)(REC->flag))
Based on this information, we can deduce that the corresponding structure looks like the following:
struct trace_event_raw_sys_enter_unlinkat {
    long dfd;
    long pathname_ptr;
    long flag;
};
Then the program can use a pointer of type of that structure as context as in int trace_unlinkat(struct trace_event_raw_sys_enter_unlinkat* ctx) However, this approach is not ideal at all for portability.
If we look at the prototype int unlinkat(int dirfd, const char *pathname, int flags); which takes the following parameters:
dirfd: This is a directory file descriptor. When the pathname provided is relative, it’s interpreted relative to this directory.
pathname: This is the path of the file or directory to remove. If the pathname is absolute (starts with a /), the dirfd parameter is ignored.
flags: This parameter allows you to modify the behavior of the call. Typically, it is set to 0 for removing files. If you want to remove a directory, you must include the AT_REMOVEDIR flag, which tells the system to remove the directory instead of a regular file.
Let’s attach a probe to the entry point of the unlinkat syscall. As you’ll see, using more examples makes the process even easier.
#define __TARGET_ARCH_x86
#include "vmlinux.h"
#include <bpf/bpf_helpers.h>
#include <bpf/bpf_tracing.h>
#include <bpf/bpf_core_read.h>

struct event {
    __u32 pid;
    char comm[16];
    char filename[256];
};

struct {
    __uint(type, BPF_MAP_TYPE_RINGBUF);
    __uint(max_entries, 4096);
} events SEC(".maps");

char _license[] SEC("license") = "GPL";

SEC("tracepoint/syscalls/sys_enter_unlinkat")
int trace_unlinkat(struct trace_event_raw_sys_enter* ctx) {
    struct event *evt;

    evt = bpf_ringbuf_reserve(&events, sizeof(struct event), 0);
    if (!evt)
        return 0;

    evt->pid = bpf_get_current_pid_tgid() >> 32;
    bpf_get_current_comm(&evt->comm, sizeof(evt->comm));
    bpf_probe_read_user_str(&evt->filename, sizeof(evt->filename), (const char *)ctx->args[1]);

    bpf_ringbuf_submit(evt, 0);

    return 0;
}
We captured the pathname by accessing the second argument (pathname is the second argument in unlinkat syscall) in the context’s args array, as shown in:
bpf_probe_read_user_str(&evt->filename, sizeof(evt->filename), (const char *)ctx->args[1]);
By creating and removing files and directories, you should see similar output:
Successfully started! Listening for events...
Process ID: 1899, Command: rm, Filename: test1
Process ID: 1914, Command: rm, Filename: test2
Process ID: 1918, Command: rm, Filename: test3
As you saw, there tremendous amount of possibilities of using such probes, such as using tracepoint:syscalls:sys_enter_connect which allows you to monitor when a process initiates a network connection using the connect() system call, and this is just the tip of the iceberg.