Kprobe and Kretprobe
Writing eBPF Code
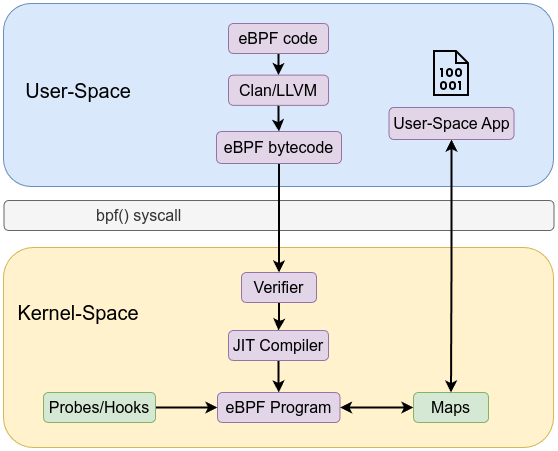
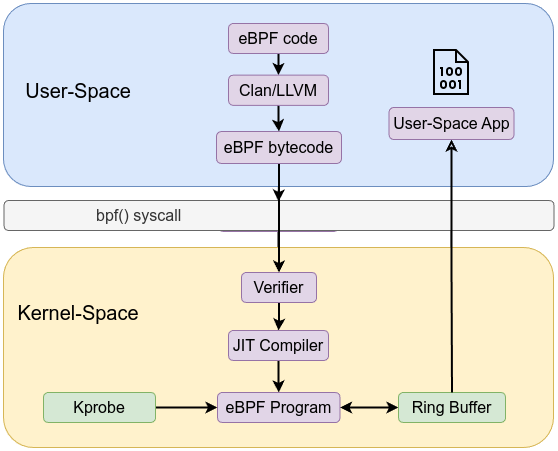
When writing eBPF code, you typically need to write two separate parts: one for kernel-space and the other for user-space.
Kernel Space Code:
The kernel-space code is responsible for performing specific tasks, such as tracing, monitoring network packets, filtering system calls, or attaching to kprobes, tracepoints, etc. This code interacts directly with the kernel and can access kernel data structures or events. The kernel space is highly sensitive, so the code running there must be safe and efficient. The kernel-space code is written in a special eBPF-compatible language (with a C-like syntax) and is loaded into the kernel using helper libraries (such as libbpf) or system calls (like bpf()).
User Space Code: User-space code is responsible for loading the eBPF program into the kernel, attaching it to specific hooks or events, and managing communication between user space and kernel space. It also handles tasks like retrieving data from the kernel (e.g., using maps for data storage). User-space code is written in a regular programming language (such as C or Python) and runs outside the kernel, as a user-space application.
libbpf
libbpf is a C-based library designed to facilitate interaction with the eBPF subsystem in the Linux kernel. It provides a set of high-level and low-level APIs that simplify of loading, verifying, and managing eBPF programs. By handling the complexities of working with the kernel, libbpf enables developers to focus more on optimizing their eBPF code’s performance and correctness, rather than managing the details of user-space and kernel-space interactions.
libbpf includes a variety of BPF helper functions that ease development. These helpers allow eBPF programs to interact with the system more effectively, providing functions for tasks like debugging, manipulating network packets, and working with eBPF maps. This reduces the amount of code developers need to write, enabling them to focus on the logic of their BPF programs.
One of the most significant benefits of libbpf is its support for eBPF CO-RE (Compile Once, Run Everywhere), a mechanism that enhances the portability of eBPF programs. By leveraging BTF (BPF Type Format)—a metadata format that describes kernel data types such as data structures, unions, enums, and function prototypes—libbpf allows developers to write eBPF programs that can be compiled once and run across multiple kernel versions. CO-RE produces an ELF file with precompiled eBPF bytecode that can run across different kernel versions, eliminating the need for recompiling or modifying eBPF code for different systems. BTF information can be generated via
sudo bpftool btf dump file /sys/kernel/btf/vmlinux format c > vmlinux.h
Simply, libbpf uses BTF information to align or modify the types and fields in the eBPF program with the current running kernel. For more information about eBPF CO-RE, please refer to this post.
As stated in kernel documentation
libbpf provides APIs that user space programs can use to manipulate the BPF programs by triggering different phases of a BPF application lifecycle.

The following section provides a brief overview of each phase in the BPF life cycle:

Open phase: In this phase, libbpf parses the BPF object file and discovers BPF maps, BPF programs, and global variables. After a BPF app is opened, user space apps can make additional adjustments (setting BPF program types, if necessary; pre-setting initial values for global variables, etc.) before all the entities are created and loaded.

Load phase: In the load phase, libbpf creates BPF maps, resolves various relocations, and verifies and loads BPF programs into the kernel. At this point, libbpf validates all the parts of a BPF application and loads the BPF program into the kernel, but no BPF program has yet been executed. After the load phase, it’s possible to set up the initial BPF map state without racing with the BPF program code execution.

Attachment phase: In this phase, libbpf attaches BPF programs to various BPF hook points (e.g., tracepoints, kprobes, cgroup hooks, network packet processing pipeline, etc.). During this phase, BPF programs perform useful work such as processing packets, or updating BPF maps and global variables that can be read from user space.

Tear down phase: In the tear down phase, libbpf detaches BPF programs and unloads them from the kernel. BPF maps are destroyed, and all the resources used by the BPF app are freed.
A BPF Object Skeleton File is a C header file (.skel.h) generated using bpftool from a compiled eBPF object file. This header file provides a structured interface for interacting with the eBPF program, simplifying its management from user space. For developers seeking simplicity, the eBPF skeleton provides a more abstracted interface for interacting with eBPF programs. The skeleton generates functions such as <name>__open(), <name>__load(), <name>__attach(), and <name>__destroy(), which automate key steps in the eBPF lifecycle, allowing developers to manage eBPF programs with less effort. The skeleton also provides access to global variables and maps, which are directly accessible as structured fields in the user-space program, making it easier to manipulate these elements without relying on string-based lookups.
eBPF Probes
eBPF probes are mechanisms used to attach eBPF programs to specific events within the kernel or user-space. These probes allow developers to dynamically hook into various parts of the system and execute eBPF programs when those events or locations are triggered, enabling data collection, behavior monitoring, or influencing execution.
eBPF probes allow attaching to various points in the kernel’s execution flow to observe and sometimes modify behavior. Each type of eBPF probe corresponds to a particular attachment point. Some common probe types include:
- kprobe: Attaches to almost any kernel instruction address.
- kretprobe (return probe): Attaches to the return point of a kernel function.
- uprobe and uretprobe: Attach to user-space functions and their returns.
- tracepoint and raw_tracepoint: Attach to static kernel tracepoints for predefined events.
- fentry: Attached to the entry point of a kernel function using an enhanced, lower-overhead mechanism.
- fexit: Attached to the return of a kernel function using an enhanced, lower-overhead mechanism.
kprobe-kretprobe
Kprobes
A kprobe is a dynamic instrumentation mechanism that allows you to attach a custom handler at almost any kernel instruction address, often used at the start of a kernel function. When the CPU executes this probed instruction, it triggers the kprobe handler. This handler can inspect CPU registers, function arguments, and kernel memory state before the original instruction executes. kprobe-based eBPF programs are classified under the program type BPF_PROG_TYPE_KPROBE.
You can list all of the kernel exported symbols using sudo cat /proc/kallsyms and we are only interested in T which represents globally visible text symbols (Code) and they can be attached.
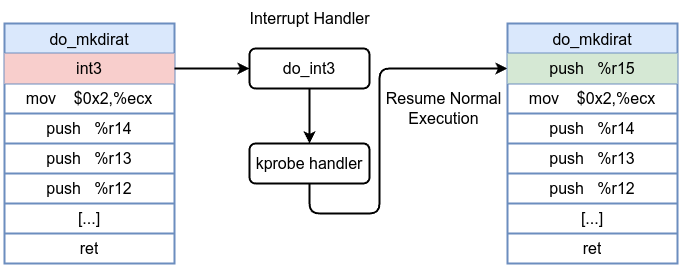
How Kprobes Work Under the Hood
- When you register a kprobe on a kernel function (e.g.,
do_mkdirat), the kernel replaces the first instruction bytes at that function’s entry with a breakpoint instructionint3. - When the function is called, the CPU hits the breakpoint instruction, a trap occurs.
- The kernel’s kprobe infrastructure intercepts this exception and calls your eBPF program’s handler. Your eBPF code then has access to the function arguments and can perform any allowed eBPF operations (e.g., reading fields, printing debug information).
- After the handler completes its task, instruction flow resumes by single-stepping the original instruction. If the kprobe is no longer needed, the original instruction is restored in place of the breakpoint.
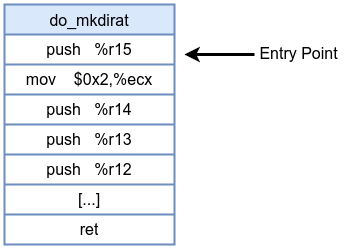
Before kprobe:

After kprobe insertion:
Note
kprobes can be attached to nearly any kernel instruction. However, certain functions—such as those involved in kprobe handling itself—cannot be probed, as doing so would trigger recursive traps and potentially destabilize the kernel.As stated in eBPF Docs
The context passed to kprobe programs is `struct pt_regs`. This structure is different for each CPU architecture since it contains a copy of the CPU registers at the time the kprobe was invoked.

It is common for kprobe programs to use the macros from the Libbpf `bpf_tracing.h` header file, which defines `PT_REGS_PARM1` ... `PT_REGS_PARM5` as well as a number of others. These macros will translate to the correct field in `struct pt_regs` depending on the current architecture. Communicating the architecture you are compiling the BPF program for is done by defining one of the `__TARGET_ARCH_*` values in your program or via the command line while compiling.
PT_REGS_PARMX macros are defined in bpf_tracing.h
#define PT_REGS_PARM1(x) (__PT_REGS_CAST(x)->__PT_PARM1_REG)
#define PT_REGS_PARM2(x) (__PT_REGS_CAST(x)->__PT_PARM2_REG)
#define PT_REGS_PARM3(x) (__PT_REGS_CAST(x)->__PT_PARM3_REG)
#define PT_REGS_PARM4(x) (__PT_REGS_CAST(x)->__PT_PARM4_REG)
#define PT_REGS_PARM5(x) (__PT_REGS_CAST(x)->__PT_PARM5_REG)
#define PT_REGS_PARM6(x) (__PT_REGS_CAST(x)->__PT_PARM6_REG)
#define PT_REGS_PARM7(x) (__PT_REGS_CAST(x)->__PT_PARM7_REG)
#define PT_REGS_PARM8(x) (__PT_REGS_CAST(x)->__PT_PARM8_REG)
struct pt_regs is defined in /arch/x86/include/uapi/asm/ptrace.h for the x86-64 architecture:
struct pt_regs {
	unsigned long r15;
	unsigned long r14;
	unsigned long r13;
	unsigned long r12;
	unsigned long rbp;
	unsigned long rbx;
	unsigned long r11;
	unsigned long r10;
	unsigned long r9;
	unsigned long r8;
	unsigned long rax;
	unsigned long rcx;
	unsigned long rdx;
	unsigned long rsi;
	unsigned long rdi;
	unsigned long orig_rax;
	unsigned long rip;
	unsigned long cs;
	unsigned long eflags;
	unsigned long rsp;
	unsigned long ss;
};
The struct pt_regs stores the CPU’s register state at the time of an interrupt, system call, or exception, enabling the kernel to save and restore the execution context of a process. By capturing the state of general-purpose registers, segment registers, and special registers (such as the instruction pointer and stack pointer).
In the next example we will attach a kprobe to start of of do_mkdirat syscall which is used to create a new directory.
do_mkdirat prototype is int do_mkdirat(int dfd, struct filename *name, umode_t mode); and it has 3 parameters dfd, struct filename, mode.
dfd: stands for “directory file descriptor.” It specifies the directory relative to which the new directory should be created.
struct filename is a kernel data structure defined in /include/linux/fs.h
struct filename {
	const char		*name;	/* pointer to actual string */
	const __user char	*uptr;	/* original userland pointer */
	atomic_t		refcnt;
	struct audit_names	*aname;
	const char		iname[];
};
mode represents file permissions for the created directory.
Now let’s start with eBPF kernel code
#define __TARGET_ARCH_x86
#include "vmlinux.h"
#include <bpf/bpf_helpers.h>
#include <bpf/bpf_tracing.h>
#include <bpf/bpf_core_read.h>

char LICENSE[] SEC("license") = "GPL";

SEC("kprobe/do_mkdirat")
int kprobe_mkdir(struct pt_regs *ctx)
{
    pid_t pid;
    const char *filename;
    umode_t mode;

    pid = bpf_get_current_pid_tgid() >> 32;
    struct filename *name = (struct filename *)PT_REGS_PARM2(ctx);
    filename = BPF_CORE_READ(name, name);
	mode = PT_REGS_PARM3(ctx);

    bpf_printk("KPROBE ENTRY pid = %d, filename = %s, mode = %u\n", pid, filename,mode);

    return 0;
}
First, as we just explained that we need to define __TARGET_ARCH__XX according to your architecture then include vmlinux.h
#define __TARGET_ARCH_x86
#include "vmlinux.h"
#include <bpf/bpf_helpers.h>
#include <bpf/bpf_tracing.h>
#include <bpf/bpf_core_read.h>
bpf_core_read.h header file provides macros for reading data from kernel or user space in a way that is compatible with BPF CO-RE (Compile Once, Run Everywhere) such as BPF_CORE_READ macro.
char LICENSE[] SEC("license") = "GPL";
Then we added license we we discussed in the previous chapter
SEC("kprobe/do_mkdirat")
int kprobe_mkdir(struct pt_regs *ctx)
SEC It tells the compile what ELF section to put which is kprobe and where to attach it which is do_mkdirat. Then kprobe handler kprobe_mkdir that gets executed when do_mkdirat entry point is triggered.
struct pt_regs *ctx is the context passed to the eBPF program by the kernel. It contains information about the registers at the time the function was invoked, including the function arguments, return addresses. The ctx pointer will be used to extract these values.
pid = bpf_get_current_pid_tgid() >> 32;
bpf_get_current_pid_tgid() is an eBPF helper function that returns a 64-bit value, where:
- The lower 32 bits represent the thread group ID (TGID), which is the PID of the thread that initiated the system call.
- The upper 32 bits represent the thread ID (PID) of the current thread.
Since we are interested in the
PID, we shift the 64-bit value to the right by 32 bits (>> 32) to get just the process ID (PID) of the current process.
    struct filename *name = (struct filename *)PT_REGS_PARM2(ctx);
    filename = BPF_CORE_READ(name, name);
PT_REGS_PARM2(ctx): As previously discussed, this is a macro used to extract the second argument of the function being probed. In this case, the second argument is a pointer to the filename structure, which is passed to the do_mkdirat function. struct filename *name: This line casts the second parameter (a pointer to struct filename) to the name variable. struct filename holds the path to the directory to be created.
BPF_CORE_READ(name, name): It uses the BPF_CORE_READ macro from the bpf_core_read.h header. This macro is a helper function designed to safely read fields from kernel structures in a way that is compatible with BPF CO-RE (Compile Once, Run Everywhere) and it’s necessary because kernel structures may change between different kernel versions, and BPF_CORE_READ ensures that the field name can be accessed in a manner that works across various kernel versions.
name field: In this case, the field name in struct filename holds the string representing the path of the directory to be created.
mode = PT_REGS_PARM3(ctx);
PT_REGS_PARM3(ctx): This macro extracts the third argument passed to do_mkdirat, which represents the mode (permissions) of the directory to be created.
bpf_printk("KPROBE ENTRY pid = %d, filename = %s, mode = %u\n", pid, filename,mode);
bpf_printk: This is an eBPF macro that allows printing formatted output to the kernel’s trace buffer, which is accessible via /sys/kernel/debug/tracing/trace_pipe. bpf_printk only supports up to 3 arguments.
At this point we need to compile this code into an object file using clang with help from bpftool.
- Install required tools
sudo apt install linux-tools-$(uname -r) clang llvm libbpf-dev bpftool, - Generate
vmlinux.hviasudo bpftool btf dump file /sys/kernel/btf/vmlinux format c > vmlinux.h - Compile eBPF code into an object file
clang -g -O2 -target bpf -c kprobe-mkdirat.bpf.c -o kprobe-mkdirat.owith debugging information (-g) and optimization level-O2. The-target bpfflag ensures that Clang compiles the code for the eBPF target architecture. - Generate the skeleton header file
sudo bpftool gen skeleton kprobe-mkdirat.o > kprobe-mkdirat.skel.h
Note
If you encounter the error/usr/include/linux/types.h:5:10: fatal error: 'asm/types.h' file not found while compiling the eBPF kernel code , you can execute the command sudo ln -s /usr/include/x86_64-linux-gnu/asm /usr/include/asm.
Examining the generated object file llvm-objdump -h kprobe-mkdirat.o
kprobe-mkdirat.o:	file format elf64-bpf

Sections:
Idx Name                   Size     VMA              Type
  0                        00000000 0000000000000000
  1 .strtab                00000141 0000000000000000
  2 .text                  00000000 0000000000000000 TEXT
  3 kprobe/do_mkdirat      000000a8 0000000000000000 TEXT
  4 .relkprobe/do_mkdirat  00000010 0000000000000000
  5 license                0000000d 0000000000000000 DATA
  6 .rodata                00000031 0000000000000000 DATA
[...]
The generated object file kprobe-mkdirat.o has the file format ELF64-BPF, indicating it is a 64-bit ELF object file specifically for BPF (eBPF) code.
kprobe/do_mkdirat This is the section header where the actual eBPF program resides, as indicated by SEC("kprobe/do_mkdirat") in the code. This section contains the code that will be executed when the do_mkdirat kprobe is triggered.
Let’s move to the user-space code. The following code is derived from libbpf-bootstrap
#include <stdio.h>
#include <unistd.h>
#include <sys/resource.h>
#include <bpf/libbpf.h>
#include "kprobe-mkdirat.skel.h"

static int libbpf_print_fn(enum libbpf_print_level level, const char *format, va_list args)
{
	return vfprintf(stderr, format, args);
}

int main(int argc, char **argv)
{
	struct kprobe_mkdirat *skel;
	int err;

	libbpf_set_print(libbpf_print_fn);

	skel = kprobe_mkdirat__open();
	if (!skel) {
		fprintf(stderr, "Failed to open BPF skeleton\n");
		return 1;
	}

	err = kprobe_mkdirat__load(skel);
	if (err) {
		fprintf(stderr, "Failed to load and verify BPF skeleton\n");
		goto cleanup;
	}

	err = kprobe_mkdirat__attach(skel);
	if (err) {
		fprintf(stderr, "Failed to attach BPF skeleton\n");
		goto cleanup;
	}

	printf("Successfully started! Please run `sudo cat /sys/kernel/debug/tracing/trace_pipe` "
	       "to see output of the BPF programs.\n");

	for (;;) {
		fprintf(stderr, ".");
		sleep(1);
	}

cleanup:
	kprobe_mkdirat__destroy(skel);
	return -err;
}
Let’s divide the code
static int libbpf_print_fn(enum libbpf_print_level level, const char *format, va_list args)
{
	return vfprintf(stderr, format, args);
}
A function for libbpf debug and error messages.
struct kprobe_mkdirat *skel;
declares a pointer skel to a structure kprobe_mkdirat, which represents the eBPF skeleton for the eBPF program attached to the do_mkdirat kprobe. This structure is used to manage the loading, attaching, and cleanup of the eBPF program.
skel = kprobe_mkdirat__open();
This function opens the eBPF skeleton for the kprobe_mkdirat program to set up the eBPF program, including its maps, and prepares it for loading.
err = kprobe_mkdirat__load(skel);
This function loads and verifies the eBPF program defined in the skeleton. It ensures that the eBPF code is valid and ready to be attached to the kernel.
err = kprobe_mkdirat__attach(skel);
This function attaches the eBPF program to the kernel’s kprobe at the do_mkdirat function. It makes the program active and starts tracing the specified kernel function.
kprobe_mkdirat__destroy(skel);
This function cleans up and frees resources used by the BPF skeleton. It detaches the program and destroys the associated maps and other resources.
All these functions (_open(), _load(), _attach(), and _destroy()) are automatically generated from the eBPF skeleton file. As we explained earlier that the skeleton file abstracts much of the complexity of interacting with BPF programs, making it much easier to build user-space code for managing and interacting with eBPF programs. It eliminates the need for manual setup and error handling, simplify the entire process.
To compile the user-space code, we use the following command: clang -o loader loader.c -lbpf. This compiles the loader.c file and links it with the libbpf library, producing an executable named loader.
To start the eBPF program, you can use the following command: sudo ./loader. This runs the compiled user-space program loader, which loads the eBPF program, attaches it to the kernel function (in this case, the do_mkdirat function via kprobes), and starts tracing the kernel function. The sudo is necessary because eBPF programs often require root privileges to attach to kernel functions or tracepoints.
libbpf: loading object 'kprobe_mkdirat' from buffer
libbpf: elf: section(3) kprobe/do_mkdirat, size 168, link 0, flags 6, type=1
libbpf: sec 'kprobe/do_mkdirat': found program 'kprobe_mkdir' at insn offset 0 (0 bytes), code size 21 insns (168 bytes)
libbpf: elf: section(4) .relkprobe/do_mkdirat, size 16, link 27, flags 40, type=9
libbpf: elf: section(5) license, size 13, link 0, flags 3, type=1
libbpf: license of kprobe_mkdirat is GPL
libbpf: elf: section(6) .rodata, size 49, link 0, flags 2, type=1
libbpf: elf: section(17) .BTF, size 1407, link 0, flags 0, type=1
libbpf: elf: section(19) .BTF.ext, size 284, link 0, flags 0, type=1
libbpf: elf: section(27) .symtab, size 384, link 1, flags 0, type=2
libbpf: looking for externs among 16 symbols...
libbpf: collected 0 externs total
libbpf: map 'kprobe_m.rodata' (global data): at sec_idx 6, offset 0, flags 80.
libbpf: map 0 is "kprobe_m.rodata"
libbpf: sec '.relkprobe/do_mkdirat': collecting relocation for section(3) 'kprobe/do_mkdirat'
libbpf: sec '.relkprobe/do_mkdirat': relo #0: insn #14 against '.rodata'
libbpf: prog 'kprobe_mkdir': found data map 0 (kprobe_m.rodata, sec 6, off 0) for insn 14
libbpf: loading kernel BTF '/sys/kernel/btf/vmlinux': 0
libbpf: map 'kprobe_m.rodata': created successfully, fd=4
libbpf: sec 'kprobe/do_mkdirat': found 3 CO-RE relocations
libbpf: CO-RE relocating [2] struct pt_regs: found target candidate [83] struct pt_regs in [vmlinux]
libbpf: prog 'kprobe_mkdir': relo #0: <byte_off> [2] struct pt_regs.si (0:13 @ offset 104)
libbpf: prog 'kprobe_mkdir': relo #0: matching candidate #0 <byte_off> [83] struct pt_regs.si (0:13 @ offset 104)
libbpf: prog 'kprobe_mkdir': relo #0: patched insn #3 (LDX/ST/STX) off 104 -> 104
libbpf: CO-RE relocating [7] struct filename: found target candidate [4878] struct filename in [vmlinux]
libbpf: prog 'kprobe_mkdir': relo #1: <byte_off> [7] struct filename.name (0:0 @ offset 0)
libbpf: prog 'kprobe_mkdir': relo #1: matching candidate #0 <byte_off> [4878] struct filename.name (0:0 @ offset 0)
libbpf: prog 'kprobe_mkdir': relo #1: patched insn #4 (ALU/ALU64) imm 0 -> 0
libbpf: prog 'kprobe_mkdir': relo #2: <byte_off> [2] struct pt_regs.dx (0:12 @ offset 96)
libbpf: prog 'kprobe_mkdir': relo #2: matching candidate #0 <byte_off> [83] struct pt_regs.dx (0:12 @ offset 96)
libbpf: prog 'kprobe_mkdir': relo #2: patched insn #12 (LDX/ST/STX) off 96 -> 96
Successfully started! Please run `sudo cat /sys/kernel/debug/tracing/trace_pipe` to see output of the BPF programs.
..............
To view the output of the eBPF program, you can open a separate terminal window and run the following command: sudo cat /sys/kernel/debug/tracing/trace_pipe
Then in another separate terminal run mkdir testing. In the second terminal, you should now see the following output:
mkdir-2173 [003] ...21 12952.686720: bpf_trace_printk: KPROBE ENTRY pid = 2173, filename = testing, mode = 511
mode = 511. The value 511 is the decimal representation of the octal permission 0777.
To observe the behavior of loading the eBPF program, you can run strace using the following command: sudo strace -ebpf ./loader. This will trace the bpf() system calls made by the loader program.
bpf(BPF_PROG_LOAD, {prog_type=BPF_PROG_TYPE_KPROBE, insn_cnt=21, insns=0x55f5e460a0f0, license="GPL", log_level=0, log_size=0, log_buf=NULL, kern_version=KERNEL_VERSION(6, 12, 12), prog_flags=0, prog_name="kprobe_mkdir", prog_ifindex=0, expected_attach_type=BPF_CGROUP_INET_INGRESS, prog_btf_fd=4, func_info_rec_size=8, func_info=0x55f5e4608850, func_info_cnt=1, line_info_rec_size=16, line_info=0x55f5e46088d0, line_info_cnt=9, attach_btf_id=0, attach_prog_fd=0, fd_array=NULL}, 148) = 5
The previous output tells us that the program type is BPF_PROG_TYPE_KPROBE in prog_type=BPF_PROG_TYPE_KPROBE, and prog_name="kprobe_mkdir" is the eBPF program that will be executed when the do_mkdirat entry point is triggered.

Congratulations! You’ve just run your first eBPF program, and it’s a portable eBPF program that can work across different kernel versions. It wasn’t that complicated, was it?
In eBPF kernel code, we used the name of the kprobe handler as kprobe_mkdir and passed a struct pt_regs as the context for the kprobe_mkdir function. Another approach is using BPF_KPROBE, which offers a more convenient and readable way to define kprobe handlers. With BPF_KPROBE, you specify the name of the function followed by any additional arguments you want to capture, making it a simpler and cleaner method.
#define __TARGET_ARCH_x86
#include "vmlinux.h"
#include <bpf/bpf_helpers.h>
#include <bpf/bpf_tracing.h>
#include <bpf/bpf_core_read.h>

char LICENSE[] SEC("license") = "GPL";


SEC("kprobe/do_mkdirat")
int BPF_KPROBE(capture_mkdir, int dfd, struct filename *name, umode_t mode)
{
        pid_t pid;
        const char *filename;
        pid = bpf_get_current_pid_tgid() >> 32;
        filename = BPF_CORE_READ(name, name);
        bpf_printk("KPROBE ENTRY pid = %d, filename = %s, mode = %u\n", pid, filename, mode);
        return 0;
}
This approach is more convenient and readable, while giving the same results. Either way, it’s up to you to choose which method is easier for you.
bpf(BPF_PROG_LOAD, {prog_type=BPF_PROG_TYPE_KPROBE, insn_cnt=22, insns=0x556e4ec810e0, license="GPL", log_level=0, log_size=0, log_buf=NULL, kern_version=KERNEL_VERSION(6, 12, 12), prog_flags=0, prog_name="capture_mkdir", prog_ifindex=0, expected_attach_type=BPF_CGROUP_INET_INGRESS, prog_btf_fd=4, func_info_rec_size=8, func_info=0x556e4ec7f840, func_info_cnt=1, line_info_rec_size=16, line_info=0x556e4ec7f8c0, line_info_cnt=8, attach_btf_id=0, attach_prog_fd=0, fd_array=NULL}, 148) = 5
Now let’s move forward to walkthrough kretprobe.
Kretprobes
A kretprobe fires when a monitored function returns. While a kprobe targets function entry (or a specific instruction), a kretprobe targets function exit. By pairing a kprobe at function entry with a kretprobe at function exit, you can measure how long a function took to run or check its return value. kretprobe-based eBPF programs are also classified under the program type BPF_PROG_TYPE_KPROBE
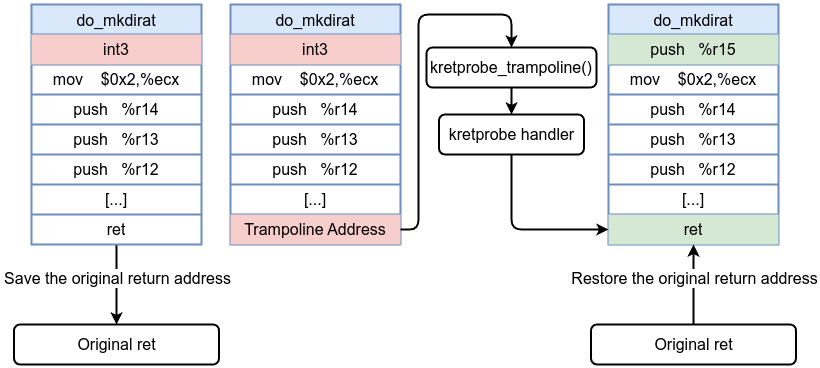
How Kretprobes Work Under the Hood
- When you register a kretprobe for a function, the kprobe mechanism inserts a probe at the function’s entry to store the original return address and replace it with a trampoline.
- The original return address is replaced with kretprobe_trampoline() address (which is the address of the trampoline) during function entry. The trampoline is also kprobed.
- When the function returns, control jumps to the trampoline instead of the original return address.
- Hitting the trampoline triggers the kretprobe handler. This handler can access the function’s return value and any data stored at entry time.
- The original return address is restored, and the function’s caller proceeds as usual.
Before kretprobe:
After kretprobe insertion:
Now let’s take a look at the same example by hooking kretprobe to do_mkdirat. First, Let’s look at the eBPF kernel code.
#define __TARGET_ARCH_x86
#include "vmlinux.h"
#include <bpf/bpf_helpers.h>
#include <bpf/bpf_tracing.h>
#include <bpf/bpf_core_read.h>

char LICENSE[] SEC("license") = "GPL";

SEC("kretprobe/do_mkdirat")
int kretprobe_mkdir(struct pt_regs *ctx)
{
        pid_t pid;
        pid = bpf_get_current_pid_tgid() >> 32;
        long ret = PT_REGS_RC(ctx);
        bpf_printk("KPROBE ENTRY pid = %d, return = %d\n", pid, ret);
        return 0;
}
We changed SEC from ("kprobe/do_mkdirat") to ("kretprobe/do_mkdirat")
SEC("kretprobe/do_mkdirat")
int kretprobe_mkdir(struct pt_regs *ctx)
Using PT_REGS_RC macro to extract the return value form pt_regs structure. Macro PT_REGS_RC is defined in bpf_tracing.h as
#define PT_REGS_RC(x) (__PT_REGS_CAST(x)->__PT_RC_REG)
To compile we could do exactly the same as we did in the previous kprobe example.
- Generate
vmlinux.hvia
sudo bpftool btf dump file /sys/kernel/btf/vmlinux format c > vmlinux.h
- Compile eBPF code into an object file
clang -g -O2 -target bpf -c kretprobe-mkdirat.bpf.c -o kretprobe-mkdirat.owith debugging information (-g) and optimization level-O2. The-target bpfflag ensures that Clang compiles the code for the eBPF target architecture. - Generate the skeleton header file
sudo bpftool gen skeleton kretprobe-mkdirat.o > kprobe-kretprobe.skel.h
Moving to the second part which is the user-space code for opening, loading, attaching and destroying the eBPF code, let’s use the the previous code and modify it.
#include <stdio.h>
#include <unistd.h>
#include <sys/resource.h>
#include <bpf/libbpf.h>
#include "kretprobe-mkdirat.skel.h"

static int libbpf_print_fn(enum libbpf_print_level level, const char *format, va_list args)
{
        return vfprintf(stderr, format, args);
}

int main(int argc, char **argv)
{
        struct kretprobe_mkdirat *skel;
        int err;

        libbpf_set_print(libbpf_print_fn);

        skel = kretprobe_mkdirat__open();
        if (!skel) {
                fprintf(stderr, "Failed to open BPF skeleton\n");
                return 1;
        }

        err = kretprobe_mkdirat__load(skel);
        if (err) {
                fprintf(stderr, "Failed to load and verify BPF skeleton\n");
                goto cleanup;
        }

        err = kretprobe_mkdirat__attach(skel);
        if (err) {
                fprintf(stderr, "Failed to attach BPF skeleton\n");
                goto cleanup;
        }

        printf("Successfully started! Please run `sudo cat /sys/kernel/debug/tracing/trace_pipe` "
               "to see output of the BPF programs.\n");

        for (;;) {
                fprintf(stderr, ".");
                sleep(1);
        }

cleanup:
        kretprobe_mkdirat__destroy(skel);
        return -err;
}
We need to change some lines here to match out generated skeleton file such as
#include "kretprobe-mkdirat.skel.h"
struct kretprobe_mkdirat *skel;
skel = kretprobe_mkdirat__open();
err = kretprobe_mkdirat__load(skel);
err = kretprobe_mkdirat__attach(skel);
kretprobe_mkdirat__destroy(skel);
Finally, let’s compile it and link it to libbpf clang -o loader loader.c -lbpf then run it as the previous with sudo ./loader. Then sudo cat /sys/kernel/debug/tracing/trace_pipe in a separate terminal. Then use command mkdir test and we get
<...>-2053 [002] ...21 5359.243727: bpf_trace_printk: KPROBE ENTRY pid = 2053, return = 0
Return value 0 indicates success, while any non-zero value represents an error, with the specific error codes defined in /include/uapi/asm-generic/errno-base.h.
#define	EPERM		 1	/* Operation not permitted */
#define	ENOENT		 2	/* No such file or directory */
#define	ESRCH		 3	/* No such process */
#define	EINTR		 4	/* Interrupted system call */
#define	EIO		     5	/* I/O error */
#define	ENXIO		 6	/* No such device or address */
#define	E2BIG		 7	/* Argument list too long */
#define	ENOEXEC		 8	/* Exec format error */
#define	EBADF		 9	/* Bad file number */
#define	ECHILD		10	/* No child processes */
#define	EAGAIN		11	/* Try again */
#define	ENOMEM		12	/* Out of memory */
#define	EACCES		13	/* Permission denied */
#define	EFAULT		14	/* Bad address */
#define	ENOTBLK		15	/* Block device required */
#define	EBUSY		16	/* Device or resource busy */
#define	EEXIST		17	/* File exists */
#define	EXDEV		18	/* Cross-device link */
#define	ENODEV		19	/* No such device */
#define	ENOTDIR		20	/* Not a directory */
#define	EISDIR		21	/* Is a directory */
#define	EINVAL		22	/* Invalid argument */
#define	ENFILE		23	/* File table overflow */
#define	EMFILE		24	/* Too many open files */
#define	ENOTTY		25	/* Not a typewriter */
#define	ETXTBSY		26	/* Text file busy */
#define	EFBIG		27	/* File too large */
#define	ENOSPC		28	/* No space left on device */
#define	ESPIPE		29	/* Illegal seek */
#define	EROFS		30	/* Read-only file system */
#define	EMLINK		31	/* Too many links */
#define	EPIPE		32	/* Broken pipe */
#define	EDOM		33	/* Math argument out of domain of func */
#define	ERANGE		34	/* Math result not representable */
For example, if you try to run mkdir test command again you will get the following output.
mkdir-2054 [003] ...21 5365.024388: bpf_trace_printk: KPROBE ENTRY pid = 2054, return = -17
This indicate EEXIST - file exists. Running it with strace sudo strace -ebpf ./loader to capture bpf() syscalls shows that the the prog_type is BPF_PROG_TYPE_KPROBE and the prog_name is kretprobe_mkdir
bpf(BPF_PROG_LOAD, {prog_type=BPF_PROG_TYPE_KPROBE, insn_cnt=11, insns=0x55eb0c2b8000, license="GPL", log_level=0, log_size=0, log_buf=NULL, kern_version=KERNEL_VERSION(6, 12, 12), prog_flags=0, prog_name="kretprobe_mkdir", prog_ifindex=0, expected_attach_type=BPF_CGROUP_INET_INGRESS, prog_btf_fd=4, func_info_rec_size=8, func_info=0x55eb0c2b67f0, func_info_cnt=1, line_info_rec_size=16, line_info=0x55eb0c2b6870, line_info_cnt=6, attach_btf_id=0, attach_prog_fd=0, fd_array=NULL}, 148) = 5
The better approach is to use BPF_KRETPROBE macro, which offers a more convenient and readable way to define kretprobe handlers, as mentioned earlier.
#define __TARGET_ARCH_x86
#include "vmlinux.h"
#include <bpf/bpf_helpers.h>
#include <bpf/bpf_tracing.h>
#include <bpf/bpf_core_read.h>

char LICENSE[] SEC("license") = "GPL";

SEC("kretprobe/do_mkdirat")
int BPF_KRETPROBE(do_mkdirat, int ret)
{
        pid_t pid;
        pid = bpf_get_current_pid_tgid() >> 32;
        bpf_printk("KPROBE ENTRY pid = %d, return = %d\n", pid, ret);
        return 0;
}
As you can see, this is much simpler and cleaner.
Combining the use of both kprobe and kretprobe on the do_mkdirat kernel function provides insight into the arguments received by do_mkdirat and its return value. This type of instrumentation is valuable for several reasons, such as debugging, system performance monitoring, maintaining a detailed record of directory creation for forensic analysis, and detecting malicious activities like attempting unauthorized directory creation.
/sys/kernel/debug/tracing/trace_pipe is globally shared interface that aggregates all ebpf programs trace events, which can lead to contention and data mixing. In contrast, using maps provides a dedicated, structured, and efficient mechanism to pass data between kernel and user space, offering better control and isolation.
Let’s go forward and use maps instead of the kernel’s trace buffer /sys/kernel/debug/tracing/trace_pipe. Using the first example and add BPF_MAP_TYPE_PERF_EVENT_ARRAY to it and store our data using bpf_perf_event_output in BPF perf event.

#define __TARGET_ARCH_x86
#include "vmlinux.h"
#include <bpf/bpf_helpers.h>
#include <bpf/bpf_tracing.h>
#include <bpf/bpf_core_read.h>

struct event {
    pid_t pid;
    char filename[256];
    umode_t mode;
};

struct {
    __uint(type, BPF_MAP_TYPE_PERF_EVENT_ARRAY);
    __uint(max_entries, 1024);
    __type(key, int);
    __type(value, int);
} mkdir SEC(".maps");

char LICENSE[] SEC("license") = "GPL";

SEC("kprobe/do_mkdirat")
int BPF_KPROBE(do_mkdirat, int dfd, struct filename *name, umode_t mode)
{
    pid_t pid = bpf_get_current_pid_tgid() >> 32;
    struct event ev = {};
    ev.pid = pid;
    ev.mode = mode;
    const char *filename = BPF_CORE_READ(name, name);
    bpf_probe_read_str(ev.filename, sizeof(ev.filename), filename);
    bpf_perf_event_output(ctx, &mkdir, BPF_F_CURRENT_CPU, &ev, sizeof(ev));
    return 0;
}
First we defined the structure for the event data that will be sent to user-space.
struct event {
    pid_t pid;
    char filename[256];
    umode_t mode;
};
Then defined a map of type BPF_MAP_TYPE_PERF_EVENT_ARRAY as we explained earlier.
struct {
    __uint(type, BPF_MAP_TYPE_PERF_EVENT_ARRAY); // Type of BPF map
    __uint(max_entries, 1024);                   // Maximum number of entries in the map
    __type(key, int);                            // Type of the key
    __type(value, int);                          // Type of the value
} mkdir SEC(".maps");
Then we created ev of type struct event and store both pid and mode
    struct event ev = {};
    ev.pid = pid;
    ev.mode = mode;
Next, we used bpf_probe_read_str to safely read a string from kernel space and copy it into the eBPF program’s memory space.
bpf_probe_read_str(ev.filename, sizeof(ev.filename), filename);
Finally, write ev data into our created map mkdir.
bpf_perf_event_output(ctx, &mkdir, BPF_F_CURRENT_CPU, &ev, sizeof(ev));
The user-space loader code
#include <stdio.h>
#include <unistd.h>
#include <sys/resource.h>
#include <bpf/libbpf.h>
#include <bpf/bpf.h>
#include "kprobe-mkdirat.skel.h"

#define PERF_BUFFER_PAGES 64

static int libbpf_print_fn(enum libbpf_print_level level, const char *format, va_list args)
{
    return vfprintf(stderr, format, args);
}

struct event {
    pid_t pid;
    char filename[256];
    mode_t mode;
};

static void handle_event(void *ctx, int cpu, void *data, __u32 data_sz)
{
    struct event *evt = (struct event *)data;
    printf("Process ID: %d, filename: %s, mode: %d\n", evt->pid, evt->filename, evt->mode);
}

static void handle_lost_events(void *ctx, int cpu, __u64 lost_cnt)
{
    fprintf(stderr, "Lost %llu events on CPU %d\n", lost_cnt, cpu);
}

int main(int argc, char **argv)
{
    struct kprobe-mkdirat *skel;
    struct perf_buffer *pb = NULL;
    int err;

    libbpf_set_print(libbpf_print_fn);

    skel = kprobe-mkdirat__open();
    if (!skel) {
        fprintf(stderr, "Failed to open BPF skeleton\n");
        return 1;
    }

    err = kprobe-mkdirat__load(skel);
    if (err) {
        fprintf(stderr, "Failed to load and verify BPF skeleton\n");
        goto cleanup;
    }

    err = kprobe-mkdirat__attach(skel);
    if (err) {
        fprintf(stderr, "Failed to attach BPF skeleton\n");
        goto cleanup;
    }

    pb = perf_buffer__new(bpf_map__fd(skel->maps.mkdir), PERF_BUFFER_PAGES, handle_event, handle_lost_events, NULL, NULL);
    if (!pb) {
        fprintf(stderr, "Failed to create perf buffer\n");
        goto cleanup;
    }

    printf("Successfully started! Listening for events...\n");

    while (1) {
        err = perf_buffer__poll(pb, 100);
        if (err < 0) {
            fprintf(stderr, "Error polling perf buffer\n");
            break;
        }
    }

cleanup:
    perf_buffer__free(pb);
    kprobe-mkdirat__destroy(skel);
    return -err;
}
First we defined the structure to store event data.
struct event {
    pid_t pid;
    char filename[256];
    umode_t mode;
};
Next, we defined handle_event which gets called when a new event is read from the perf buffer. It casts the data pointer to the struct event and prints the pid, filename, and mode values. Then, we defined handle_lost_events which handles lost events (when the buffer overflows). It prints a message indicating how many events were lost on a specific CPU.
static void handle_event(void *ctx, int cpu, void *data, __u32 data_sz)
{
    struct event *evt = (struct event *)data;
    printf("Process ID: %d, filename: %s, mode: %d\n", evt->pid, evt->filename, evt->mode);
}

static void handle_lost_events(void *ctx, int cpu, __u64 lost_cnt)
{
    fprintf(stderr, "Lost %llu events on CPU %d\n", lost_cnt, cpu);
}
Then we Initialize pb to hold the perf buffer, struct perf_buffer is defined in /tools/lib/bpf/libbpf.c
struct perf_buffer *pb = NULL;
Next, we created a perf buffer for our perf array map BPF_MAP_TYPE_PERF_EVENT_ARRAY using perf_buffer__new and it has the following prototype
struct perf_buffer * perf_buffer__new (int map_fd, size_t page_cnt, perf_buffer_sample_fn sample_cb, perf_buffer_lost_fn lost_cb, void *ctx, const struct perf_buffer_opts *opts)
perf_buffer__new takes a file descriptor for BPF_MAP_TYPE_PERF_EVENT_ARRAY , memory page size for each CPU, a function to invoke on each each received data, a function to invoke in case of data loss, *ctx and *opts.
    pb = perf_buffer__new(bpf_map__fd(skel->maps.mkdir), PERF_BUFFER_PAGES, handle_event, handle_lost_events, NULL, NULL);
    if (!pb) {
        fprintf(stderr, "Failed to create perf buffer\n");
        goto cleanup;
    }
perf_buffer__poll is a function provided by the libbpf library that allows user-space applications to poll a perf buffer for new data. It has the following prototype:
int perf_buffer__poll (struct perf_buffer *pb, int timeout_ms)
err = perf_buffer__poll(pb, 100);
If Positive timeout_ms: Blocks for the specified time (e.g., 100ms). If data arrives within that time, it processes and returns. If no data arrives, it returns 0.
Iftimeout_ms == 0: Non-blocking. Checks immediately for data. Returns 0 if no data is available.
If Negative timeout_ms: Blocks indefinitely until data becomes available.
Finally, free perf buffer resource.
perf_buffer__free(pb);
After compiling as we did before, run loader using sudo and run mkdir /tmp/test in a new terminal.
[...]
libbpf: CO-RE relocating [11] struct pt_regs: found target candidate [136] struct pt_regs in [vmlinux]
libbpf: prog 'do_mkdirat': relo #0: <byte_off> [11] struct pt_regs.si (0:13 @ offset 104)
libbpf: prog 'do_mkdirat': relo #0: matching candidate #0 <byte_off> [136] struct pt_regs.si (0:13 @ offset 104)
libbpf: prog 'do_mkdirat': relo #0: patched insn #1 (LDX/ST/STX) off 104 -> 104
libbpf: prog 'do_mkdirat': relo #1: <byte_off> [11] struct pt_regs.dx (0:12 @ offset 96)
libbpf: prog 'do_mkdirat': relo #1: matching candidate #0 <byte_off> [136] struct pt_regs.dx (0:12 @ offset 96)
libbpf: prog 'do_mkdirat': relo #1: patched insn #2 (LDX/ST/STX) off 96 -> 96
libbpf: CO-RE relocating [25] struct filename: found target candidate [1410] struct filename in [vmlinux]
libbpf: prog 'do_mkdirat': relo #2: <byte_off> [25] struct filename.name (0:0 @ offset 0)
libbpf: prog 'do_mkdirat': relo #2: matching candidate #0 <byte_off> [1410] struct filename.name (0:0 @ offset 0)
libbpf: prog 'do_mkdirat': relo #2: patched insn #73 (ALU/ALU64) imm 0 -> 0
libbpf: map 'mkdir': created successfully, fd=3
Successfully started! Listening for events...
Process ID: 2416, filename: /tmp/test, mode: 511
Tracing bpf() syscall using strace
[...]
bpf(BPF_MAP_CREATE, {map_type=BPF_MAP_TYPE_PERF_EVENT_ARRAY, key_size=4, value_size=4, max_entries=1024, map_flags=0, inner_map_fd=0, map_name="mkdir", map_ifindex=0, btf_fd=0, btf_key_type_id=0, btf_value_type_id=0, btf_vmlinux_value_type_id=0, map_extra=0}, 80) = 5

bpf(BPF_PROG_LOAD, {prog_type=BPF_PROG_TYPE_KPROBE, insn_cnt=96, insns=0x55cbcd994ff0, license="GPL", log_level=0, log_size=0, log_buf=NULL, kern_version=KERNEL_VERSION(6, 12, 12), prog_flags=0, prog_name="do_mkdirat", prog_ifindex=0, expected_attach_type=BPF_CGROUP_INET_INGRESS, prog_btf_fd=4, func_info_rec_size=8, func_info=0x55cbcd9937e0, func_info_cnt=1, line_info_rec_size=16, line_info=0x55cbcd9938c0, line_info_cnt=13, attach_btf_id=0, attach_prog_fd=0, fd_array=NULL}, 148) = 5
This output tells us that there an extra component which is BPF_MAP_CREATE command creating a map of type BPF_MAP_TYPE_PERF_EVENT_ARRAY and map_name is mkdir.
Attaching a kprobe to system call can be done using the same methods or using ksyscall technique with BPF_KSYSCALL macro and ("ksyscall/syscall_name") as section. For example, SEC("ksyscall/execve") as the next example, which we will attach a kprobe to execve syscall using ksyscall. The execve system call is one of the family of exec functions in Unix-like operating systems. It is used to execute a new program by replacing the current process image with a new one. The execve syscall is declared in include/linux/syscalls.h as the following:
asmlinkage long sys_execve(const char __user *filename,
                           const char __user *const __user *argv,
                           const char __user *const __user *envp);
asmlinkage: It’s a macro to tell the compile to that arguments are passed on the stack not registers.
const char __user *filename: A pointer to the filename (a user-space string) of the program to execute.
const char __user *const __user *argv: A pointer to an array of pointers (from user space) to the argument strings for the new program.
const char __user *const __user _*envp: A pointer to an array of pointers (from user space) to the environment variables for the new program.
In next example, we will attach kprobe to execve syscall using ksyscall and we will add ring buffer to ship our events to the user-space instead of perf buffer. Ring buffer needs to be defined, reserve then submit your events. The ring buffer minimizes overhead, offering lower latency and better performance for high-frequency event reporting compared to perf buffer mechanism.
Note
In kprobe programs, syscalls and kernel functions follow different ABIs. The syscall ABI defines the transition from user space to kernel space and dictates how its arguments are passed, while the kernel function ABI governs internal calls within the kernel.#define __TARGET_ARCH_x86
#include "vmlinux.h"
#include <bpf/bpf_helpers.h>
#include <bpf/bpf_tracing.h>
#include <bpf/bpf_core_read.h>
#define MAX_ARGS 7
#define ARG_SIZE 128
struct event {
__u32 pid;
char path[ARG_SIZE];
char argv[MAX_ARGS][ARG_SIZE];
};
struct {
    __uint(type, BPF_MAP_TYPE_RINGBUF);
    __uint(max_entries, 1 << 16);
} rb SEC(".maps");
char LICENSE[] SEC("license") = "GPL";
SEC("ksyscall/execve")
int BPF_KSYSCALL(kprobe_sys_execve,
const char *filename,
const char *const *argv)
{
struct event *ev = bpf_ringbuf_reserve(&rb, sizeof(*ev), 0);
if (!ev)
return 0;
ev->pid = bpf_get_current_pid_tgid() >> 32;
bpf_probe_read_user_str(ev->path, sizeof(ev->path), filename);
#pragma unroll
for (int i = 0; i < MAX_ARGS; i++) {
const char *argp = NULL;
bpf_probe_read_user(&argp, sizeof(argp), &argv[i]);
if (!argp) {
break;
}
bpf_probe_read_user_str(ev->argv[i], sizeof(ev->argv[i]), argp);
}
bpf_ringbuf_submit(ev, 0);
return 0;
}
We defined a ring buffer type of map with name rb:
struct {
__uint(type, BPF_MAP_TYPE_RINGBUF);
__uint(max_entries, 1 << 16);
} rb SEC(".maps");
Define a data structure event
struct event {
    __u32 pid;
    char path[ARG_SIZE];
    char argv[MAX_ARGS][ARG_SIZE];
};
We defined section with ksyscall/execve for execve syscall and use BPF_KSYSCALL macro. BPF_KSYSCALL macro defined two arguments of execve syscall instead of three because we only need filename to extract command being executed and argv to get command with its arguments and no need for environment variables.
SEC("ksyscall/execve")
int BPF_KSYSCALL(kprobe_sys_execve,
                       const char *filename,
                       const char *const *argv)
{
Then reserve space in eBPF ring buffer using bpf_ringbuf_reserve helper function which has prototype as the following void *bpf_ringbuf_reserve(void *ringbuf, u64 size, u64 flags), it take a pointer to a ring buffer definition as the first argument and the number of bytes to be reserved in the ring buffer as the second argument and returns a valid pointer with size bytes of memory available and flags must be 0.
    struct event *ev = bpf_ringbuf_reserve(&rb, sizeof(*ev), 0);
    if (!ev)
        return 0;
bpf_probe_read_user_str is an eBPF helper function that safely reads a null-terminated string from user-space memory into an eBPF program which has the prototype long bpf_probe_read_user_str(void *dst, u32 size, const void *unsafe_ptr).
bpf_probe_read_user_str(ev->path, sizeof(ev->path), filename);
This will copy the filename into path member of ev structure. The argv parameter is essentially a double pointer or pointer to a pointer (const char __user *const __user *argv), meaning it points to an array of pointers where each element is a pointer to a string. Hence, we first need to copy the pointer itself (to get the address of the string) and then copy the string data from that address. In our code, we copy up to 7 pointers (defined by #define MAX_ARGS 7) from argv into a temporary storage argp and then extract the strings into the argv member of the ev structure.
    for (int i = 0; i < MAX_ARGS; i++) {
        const char *argp = NULL;
        bpf_probe_read_user(&argp, sizeof(argp), &argv[i]);
        if (!argp) {
            break;
        }
        bpf_probe_read_user_str(ev->argv[i], sizeof(ev->argv[i]), argp);
    }
We could add the #pragma unroll compiler directive to optimize our loop. Loop unrolling duplicates the loop body multiple times, reducing the overhead of loop control by executing multiple iterations’ work within a single loop iteration. For example,
int sum = 0;
int arr[4] = {1, 2, 3, 4};

#pragma unroll
for (int i = 0; i < 4; i++) {
    sum += arr[i];
}
After unrolling:
int sum = 0;
int arr[4] = {1, 2, 3, 4};

sum += arr[0];
sum += arr[1];
sum += arr[2];
sum += arr[3];
Then we submit reserved ring buffer data to make it available in the ring buffer using bpf_ringbuf_submit helper function.
void bpf_ringbuf_submit(void *data, u64 flags) It take a pointer to data as the first argument and flag as the second argument and the flag can be as follow:
* If BPF_RB_NO_WAKEUP is specified in flags, no notification of new data availability is sent.
* If BPF_RB_FORCE_WAKEUP is specified in flags, notification of new data availability is sent unconditionally.
* If 0 is specified in flags, an adaptive notification of new data availability is sent.
bpf_ringbuf_submit(ev, 0);
What really happened is that we first reserved a space inside the ring buffer, then write our data into the reserved space and finally we submit to make these data available in the ring buffer.
#include <stdio.h>
#include <unistd.h>
#include <sys/resource.h>
#include <bpf/libbpf.h>
#include <bpf/bpf.h>
#include "ksyscall.skel.h"

#define MAX_ARGS 7

static int libbpf_print_fn(enum libbpf_print_level level, const char *format, va_list args)
{
    return vfprintf(stderr, format, args);
}

struct event {
    __u32 pid;
    char path[128];
    char argv[MAX_ARGS][128];
};

static int handle_event(void *ctx, void *data, size_t data_sz)
{
    struct event *e = data;

    printf("[execve] PID=%d Path=%s\n", e->pid, e->path);
    for (int i = 0; i < MAX_ARGS; i++) {
        if (e->argv[i][0] == '\0')
            break;
        printf("    argv[%d] = %s\n", i, e->argv[i]);
    }
    printf("\n");
    return 0;
}

int main(int argc, char **argv)
{
    struct ring_buffer *rb = NULL;
    struct ksyscall *skel = NULL;
    int err;

    libbpf_set_print(libbpf_print_fn);
    skel = ksyscall__open();
    if (!skel) {
        fprintf(stderr, "Failed to open BPF skeleton\n");
        return 1;
    }

    err = ksyscall__load(skel);
    if (err) {
        fprintf(stderr, "Failed to load BPF skeleton: %d\n", err);
        goto cleanup;
    }

    err = ksyscall__attach(skel);
    if (err) {
        fprintf(stderr, "Failed to attach BPF skeleton: %d\n", err);
        goto cleanup;
    }

    rb = ring_buffer__new(bpf_map__fd(skel->maps.rb), handle_event, NULL, NULL);
    if (!rb) {
        fprintf(stderr, "Failed to create ring buffer\n");
        err = 1;
        goto cleanup;
    }

    printf("Tracing execve calls... Ctrl+C to exit.\n");

    while (1) {
        err = ring_buffer__poll(rb, 100);
        if (err == -EINTR) {
            continue;
        } else if (err < 0) {
            fprintf(stderr, "Error polling ring buffer: %d\n", err);
            break;
        }
    }

cleanup:
    ring_buffer__free(rb);
    ksyscall__destroy(skel);
    return 0;
}
We Initialize rb to hold the ring buffer.
struct ring_buffer *rb = NULL;
ring_buffer__new takes a file descriptor for BPF_MAP_TYPE_RINGBUF and function to invoke on each each received data.
rb = ring_buffer__new(bpf_map__fd(skel->maps.rb), handle_event, NULL, NULL);
Then we retrieve the newly added data to the ring buffer using ring_buffer__poll function which has the following prototype:int ring_buffer__poll (struct ring_buffer *rb, int timeout_ms).
If Positive timeout_ms: Blocks for the specified time (e.g., 100ms). If data arrives within that time, it processes and returns. If no data arrives, it returns 0.
Iftimeout_ms == 0: Non-blocking. Checks immediately for data. Returns 0 if no data is available.
If Negative timeout_ms: Blocks indefinitely until data becomes available.
Compile the code:
sudo bpftool btf dump file /sys/kernel/btf/vmlinux format c > vmlinux.h
clang -g -O2 -target bpf -c ksyscall_execve.bpf.c -o ksyscall.o
sudo bpftool gen skeleton ksyscall.o > ksyscall.skel.h
clang -o loader loader.c -lbpf
sudo ./loader
Executing any commands will trigger the probe such as ls -l /etc:
Tracing execve calls... Ctrl+C to exit.
[execve] PID=2584 Path=/usr/bin/ls
    argv[0] = ls
    argv[1] = --color=auto
    argv[2] = -l
    argv[3] = /etc
Examining the code using strace sudo strace -ebpf ./loader
[...]
bpf(BPF_MAP_CREATE, {map_type=BPF_MAP_TYPE_RINGBUF, key_size=0, value_size=0, max_entries=65536, map_flags=0, inner_map_fd=0, map_name="rb", map_ifindex=0, btf_fd=5, btf_key_type_id=0, btf_value_type_id=0, btf_vmlinux_value_type_id=0, map_extra=0}, 80) = 6
[...]
bpf(BPF_PROG_LOAD, {prog_type=BPF_PROG_TYPE_KPROBE, insn_cnt=239, insns=0x55f2a2703020, license="GPL", log_level=0, log_size=0, log_buf=NULL, kern_version=KERNEL_VERSION(6, 12, 17), prog_flags=0, prog_name="kprobe_sys_exec", prog_ifindex=0, expected_attach_type=BPF_CGROUP_INET_INGRESS, prog_btf_fd=5, func_info_rec_size=8, func_info=0x55f2a2701810, func_info_cnt=1, line_info_rec_size=16, line_info=0x55f2a2701890, line_info_cnt=115, attach_btf_id=0, attach_prog_fd=0, fd_array=NULL}, 148) = 6
[...]
Shows the program type is indeed BPF_PROG_TYPE_KPROBE and it uses the map type of BPF_MAP_TYPE_RINGBUF.
A similar approach can be used with the kretsyscall with BPF_KRETPROBE macro to capture a syscall’s return value. The following probe will be triggered when execve syscall returns:
define __TARGET_ARCH_x86
#include "vmlinux.h"
#include <bpf/bpf_helpers.h>
#include <bpf/bpf_tracing.h>
#include <bpf/bpf_core_read.h>

char LICENSE[] SEC("license") = "GPL";

SEC("kretsyscall/execve")
int BPF_KRETPROBE(kretprobe_sys_execve, int ret)
{
    pid_t pid  = bpf_get_current_pid_tgid() >> 32;
    bpf_printk("Execve return :pid = %d ret = %d\n", pid , ret);
    return 0;
}
 <...>-1781 [...]  bpf_trace_printk: Execve return :pid = 1781 ret = 0
 <...>-1782 [...]  bpf_trace_printk: Execve return :pid = 1782 ret = 0
 <...>-1847 [...]  bpf_trace_printk: Execve return :pid = 1847 ret = -2