eBPF Program Types
Understanding eBPF’s capabilities is a thorough grasp of eBPF program types. Each eBPF program type represents a different interface or hook point in the kernel’s workflow. By selecting a particular program type when loading an eBPF program, the user defines the program’s environment: which kernel functions or events it can attach to, what kinds of data structures it can access, and which kernel helper functions can be called. Understanding these program types is crucial, because eBPF is not a one-size-fits-all technology. Instead, it offers a toolkit of specialized hooks, each tailored to a specific domain within the kernel.
In the Linux kernel source code, eBPF program types are listed in the UAPI header file include/uapi/linux/bpf.h. This header file provides an enumeration called enum bpf_prog_type that declares all the recognized program types.
enum bpf_prog_type {
	BPF_PROG_TYPE_UNSPEC,
	BPF_PROG_TYPE_SOCKET_FILTER,
	BPF_PROG_TYPE_KPROBE,
	BPF_PROG_TYPE_SCHED_CLS,
	BPF_PROG_TYPE_SCHED_ACT,
	BPF_PROG_TYPE_TRACEPOINT,
	BPF_PROG_TYPE_XDP,
	BPF_PROG_TYPE_PERF_EVENT,
	BPF_PROG_TYPE_CGROUP_SKB,
	BPF_PROG_TYPE_CGROUP_SOCK,
	BPF_PROG_TYPE_LWT_IN,
	BPF_PROG_TYPE_LWT_OUT,
	BPF_PROG_TYPE_LWT_XMIT,
	BPF_PROG_TYPE_SOCK_OPS,
	BPF_PROG_TYPE_SK_SKB,
	BPF_PROG_TYPE_CGROUP_DEVICE,
	BPF_PROG_TYPE_SK_MSG,
	BPF_PROG_TYPE_RAW_TRACEPOINT,
	BPF_PROG_TYPE_CGROUP_SOCK_ADDR,
	BPF_PROG_TYPE_LWT_SEG6LOCAL,
	BPF_PROG_TYPE_LIRC_MODE2,
	BPF_PROG_TYPE_SK_REUSEPORT,
	BPF_PROG_TYPE_FLOW_DISSECTOR,
	BPF_PROG_TYPE_CGROUP_SYSCTL,
	BPF_PROG_TYPE_RAW_TRACEPOINT_WRITABLE,
	BPF_PROG_TYPE_CGROUP_SOCKOPT,
	BPF_PROG_TYPE_TRACING,
	BPF_PROG_TYPE_STRUCT_OPS,
	BPF_PROG_TYPE_EXT,
	BPF_PROG_TYPE_LSM,
	BPF_PROG_TYPE_SK_LOOKUP,
	BPF_PROG_TYPE_SYSCALL, /* a program that can execute syscalls */
	BPF_PROG_TYPE_NETFILTER,
	__MAX_BPF_PROG_TYPE
};
When the user invokes the bpf() system call with the BPF_PROG_LOAD command, they specify one of these types. The kernel’s eBPF subsystem, including the verifier and the JIT compiler, then interprets the program according to the type requested. This choice determines what the program can do and which kernel functions it can safely interact with.
For example, when an operator writes an eBPF program that inspects network packets at a very early stage, they will choose the XDP (eXpress Data Path) program type. When performing dynamic tracing of kernel functions, they might use a kprobe or tracepoint program type. For building network firewalls or address-based restrictions at the cgroup level, they might opt for cgroup-related program types. Thus, each program type stands at the intersection of kernel events, context definitions, and allowed helper functions. This allows eBPF to cover a wide range of kernel instrumentation and customization scenarios while maintaining a strong safety and verification model.
It is also important to understand that each eBPF program type has a well-defined context structure and is closely tied to specific kernel functions or subsystems. For example, a socket filter program interacts with the socket layer, and the kernel provides a context structure (such as struct __sk_buff) that the eBPF program can read and manipulate. Similarly, a kprobe program type interacts with kernel functions specified by the user, and the kernel exposes function arguments through a context representing CPU registers. While kernel code is typically written in C, with some assembly and domain-specific macros, the eBPF environment operates as a restricted virtual machine inside the kernel, ensuring safety through static verification.
These eBPF programs can be attached to different types of events in the kernel, which defines where and when the program is executed. While many program types have a default attachment point deduced from the program type itself, some can attach to multiple locations in the kernel. In these cases, the attachment type must be explicitly specified to ensure the program is hooked to the correct event, such as a specific tracepoint. This distinction between program types and attachment types allows for greater flexibility and precision in how eBPF programs interact with kernel functions and events.
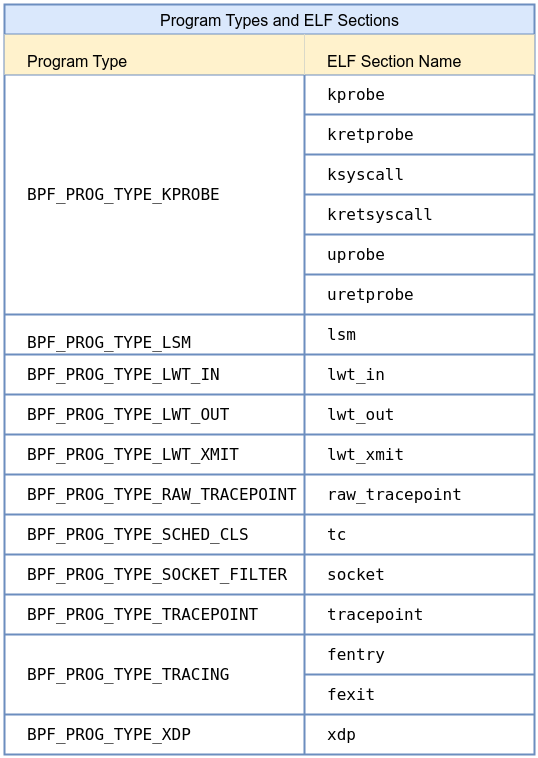
The following table, sourced from the kernel manual for libbpf, outlines the various eBPF program types and ELF section names. For more details, you can refer to the official documentation.
Sleepable eBPF programs are programs that are allowed to sleep during execution, marked by the BPF_F_SLEEPABLE flag. These programs are typically limited to specific types, such as security or tracing programs, while most other eBPF programs cannot sleep due to performance and safety reasons.
Before diving into specific program types, it is worth noting what a kernel function means in this context. The Linux kernel exports a wide range of functions, some internal and some available as hooks or tracepoints. Traditional kernel development would require a developer to write a loadable kernel module (LKM) and link it against these kernel functions, potentially breaking stability. With eBPF, however, the developer attaches to these kernel functions or kernel events indirectly, through stable, well-defined interfaces like kprobes, tracepoints, or security hooks. The kernel function from the perspective of an eBPF developer is usually a point in the kernel’s execution flow where they can gain insight or exert minimal influence.
eBPF provides indirect access through safe, monitored gateways rather than direct manipulation of kernel symbols, ensuring that even when instrumentation is performed at runtime, kernel stability and security remain intact. We have the full list of eBPF program types here. Now, let’s dive into the ones used most often.
BPF_PROG_TYPE_SOCKET_FILTER
One of the earliest and most foundational uses of eBPF is the socket filter program type. Historically, classic BPF (cBPF) was introduced for socket filtering, allowing a user program to attach a small filtering program to a raw socket. With eBPF, the socket filter functionality is extended to a more versatile and powerful environment.
A SOCKET_FILTER type program executes whenever a packet arrives at the socket it is attached to. Its context is a struct __sk_buff, a data structure defined in the kernel’s networking subsystem. This structure represents the packet’s metadata: its length, protocol, and pointers to the packet’s head and tail within the kernel’s networking stack. When the socket filter program runs, it can inspect packet headers, check IP addresses, transport layer ports, or even packet payload data.
In the kernel source code, the logic that associates a BPF program with a socket can be found in networking-related files, such as net/core/filter.c. The kernel functions involved in socket receive paths ultimately invoke the attached eBPF program. While the developer never directly calls these kernel functions from user space, understanding that the bpf() syscall with BPF_PROG_LOAD installs a filter that the kernel will call on packet reception helps conceptualize how kernel and eBPF code interact.
BPF_PROG_TYPE_KPROBE
Kprobes are a kernel mechanism that allows the insertion of breakpoints into running kernel code for debugging and tracing. A KPROBE type eBPF program leverages this mechanism to execute whenever a specified kernel function is called. The corresponding kernel functions providing this capability are found in kernel/kprobes.c and related source files. Although these are low-level kernel features, from a user’s perspective, attaching a kprobe-based eBPF program is a matter of specifying the function name and loading the program with the correct type and section name (such as SEC("kprobe/…")).
When the kernel hits the probed function, it automatically invokes the attached eBPF program. Inside the eBPF program, the context may provide access to the registers and arguments of that kernel function call. Unlike a static interface, a kprobe can be attached to almost any kernel function symbol, enabling dynamic and powerful instrumentation. This is especially useful for performance analysis, debugging kernel behavior, or collecting usage statistics for particular kernel subsystems.
For instance, consider a scenario where the user wants to monitor file opens in the kernel by probing the do_sys_open function. By attaching a kprobe eBPF program to this function, it becomes possible to log every file open event, record the filename argument, and store it in eBPF map keyed by process ID. In user space, an operator can retrieve this data to understand which processes are touching which files over time. Previously, achieving this level of detail would require recompiling the kernel with special instrumentation or using heavyweight tools. With eBPF kprobes, it is dynamic, safe, and efficient.
BPF_PROG_TYPE_TRACEPOINT
While kprobes attach to arbitrary kernel functions, tracepoints represent a set of pre-defined static instrumentation points placed throughout the kernel. Tracepoints are designed by kernel developers and maintainers to provide stable, versioned interfaces for tracing particular events. They might mark the start or end of a scheduling operation, the completion of I/O operations, or the invocation of certain subsystems.
A TRACEPOINT type eBPF program, when loaded and attached to a specific tracepoint event, is guaranteed a stable and well-defined context structure. For example, a tracepoint may provide the PID of the task involved in a scheduling event or the device number in a block I/O event. This stability makes tracepoints well-suited for long-term monitoring and performance analysis tools, because they are less prone to changes as the kernel evolves than raw function symbols.
A compelling application might be monitoring scheduling events to understand how often a particular process is context-switched. By attaching an eBPF tracepoint program to the sched_process_exec tracepoint, the user can record every time a new process executes, linking PIDs to command lines, and gathering metrics about system activity. This data can be streamed to user space and visualized or stored for later analysis. Because tracepoints are standardized, the same eBPF program code is likely to work across multiple kernel releases, enhancing maintainability and portability.
BPF_PROG_TYPE_XDP
XDP, short for eXpress Data Path, is a revolutionary approach to packet processing. XDP programs run extremely early in the packet’s journey, often at the device driver level, before the kernel’s networking stack processes the packet. This positioning allows XDP programs to achieve exceptionally high performance, making them an attractive option for load balancing, denial-of-service protection, and advanced packet filtering.
In the kernel source code, XDP integration can be found in network driver code and in net/core/dev.c, where the kernel’s receive path logic is implemented. The kernel functions that handle packet arrival invoke the XDP hook, giving the XDP eBPF program direct access to the packet’s raw buffer and metadata. The eBPF code can then decide to drop, pass, redirect, or modify the packet in place, all with minimal overhead.
Consider a data center environment with a load balancer at the edge. By deploying an XDP eBPF program, the operator can inspect incoming packets and choose which backend server to forward them to, based on dynamic policies stored in maps. If a sudden attack occurs, the same XDP program can recognize malicious patterns and drop unwanted traffic immediately, preventing the kernel’s main networking stack from wasting CPU cycles. This ability to implement custom high-performance networking logic on the fly is one of the reasons XDP is considered a game-changer in Linux networking.
BPF_PROG_TYPE_PERF_EVENT
Linux’s perf subsystem provides powerful performance monitoring capabilities, including counting hardware events (cache misses, branch mispredictions), software events (task migrations, page faults), and custom tracepoints. By attaching an eBPF PERF_EVENT type program, developers can collect and process performance data in real time. The kernel code handling these events lives largely within the kernel/events/ directory, where the perf subsystem is implemented.
A PERF_EVENT type eBPF program can run periodically based on sampling events or be triggered by certain performance conditions. Once triggered, it can record the current instruction pointer, stack trace, or other metrics into eBPF map. User space can then use tools like bpftool or perf itself to retrieve this data and generate flame graphs, histograms, or other visualizations. The benefit of using eBPF here is the flexibility to implement custom logic within the kernel’s perf event callbacks, something that would be impossible or cumbersome without eBPF.
For example, a developer might sample the CPU at a fixed rate to capture instruction pointers and thereby build a statistical profile of the hottest code paths in a production system. With a PERF_EVENT eBPF program, this sampling can be done efficiently and continuously, helping identify performance bottlenecks and guiding optimization efforts without stopping the system or deploying debugging kernels.
BPF_PROG_TYPE_RAW_TRACEPOINT
Raw tracepoints are similar to standard tracepoints, but they give the eBPF program direct access to the raw event data before the kernel applies stable formatting or abstractions. In other words, a RAW_TRACEPOINT program deals with the tracepoint’s underlying arguments and data structures without the stable, versioned interface offered by regular tracepoints. Kernel code related to raw tracepoints can also be found in tracing subsystems, but these are often less documented or guaranteed.
While this makes RAW_TRACEPOINT programs more fragile, it also grants advanced users more flexibility. If a developer needs to instrument a kernel feature that does not have a stable tracepoint or must interpret tracepoint data in a custom way, a raw tracepoint provides that opportunity. As the kernel evolves, a raw tracepoint may require updates in the eBPF program to remain compatible, but for advanced instrumentation tasks, the raw access can be invaluable.
A possible use case is for low-level file system or memory management events that have not been given stable tracepoint formats. By attaching a RAW_TRACEPOINT eBPF program to a kernel event, the user can parse the raw data structures themselves, extracting fields that normal tracepoints would not expose.
BPF_PROG_TYPE_CGROUP_SOCK_ADDR
Cgroup socket address programs integrate eBPF with Linux control groups (cgroups), providing the ability to enforce network policies at a container or service level. When a process inside a particular cgroup attempts to bind or connect a socket, the attached eBPF program runs. This allows administrators to define policies that restrict which IP addresses or ports a cgrouped process may use.
The kernel code that integrates eBPF with cgroups lives in kernel/cgroup and net/core/sock.c, among other places. By setting BPF_PROG_TYPE_CGROUP_SOCK_ADDR, the user signals that the program will be invoked at the socket layer whenever an address operation occurs. In the program, the context provides access to the requested IP and port. The eBPF code can then check these values against a map of allowed destinations and return a decision—permit or deny. This approach is more dynamic and fine-grained than static firewall rules, and it fits seamlessly into containerized environments where cgroups define the boundaries of service-level isolation.
For instance, if an operator wants to ensure that a container running a certain microservice can only connect to a backend database cluster and nowhere else, a cgroup sock address eBPF program can implement this logic. By updating the map of allowed addresses in real time, the operator can adapt policies as the network environment changes, without having to restart the containers or adjust complicated firewall configurations. This helps build more secure, isolated, and manageable service ecosystems.
BPF_PROG_TYPE_FLOW_DISSECTOR
The kernel uses a flow dissector to classify packets into flows for features like packet steering, hashing, and load balancing. By default, this classification might rely on a standard tuple of IP addresses and ports. However, in complex environments, administrators may need custom logic to handle encapsulation protocols, new transport protocols, or proprietary headers.
A FLOW_DISSECTOR type eBPF program allows customization of the kernel’s flow classification logic. Inside the kernel source, flow dissector code can be found in files like net/core/flow_dissector.c. By loading a FLOW_DISSECTOR eBPF program, the user can instruct the kernel how to parse packet headers and extract keys differently than the default code. This can be crucial in environments that rely heavily on tunneling or need specialized hashing strategies.
Imagine a data center that uses a custom tunnel header format for internal traffic. Without eBPF, the kernel’s flow classification might fail to distinguish different flows correctly, leading to poor load balancing and performance. With a FLOW_DISSECTOR eBPF program, the operator can parse these custom headers and properly hash flows across multiple CPUs or network paths.
BPF_PROG_TYPE_RAW_TRACEPOINT_WRITABLE
While most eBPF program types are focused on reading data and making decisions, RAW_TRACEPOINT_WRITABLE introduces a scenario where the program can potentially modify certain event data. This is advanced feature, allowing the developer to experiment with kernel events and, in some cases, adjust parameters or fields as they are passed to kernel subsystems. The relevant code is tightly integrated with the tracing subsystem, and due to the risk and complexity involved, the kernel imposes strict verification rules to ensure this does not compromise stability.
A RAW_TRACEPOINT_WRITABLE eBPF program might be used in highly specialized debugging scenarios, where a developer needs to simulate unusual conditions or override fields to test kernel behavior. Because this feature is neither common nor intended for typical production use, it is rarely encountered by average eBPF practitioners.
BPF_PROG_TYPE_LSM
Linux Security Modules (LSMs) are a mechanism by which security frameworks like SELinux or AppArmor integrate with the kernel to enforce access control policies. With eBPF’s introduction, it became possible to write LSM policies dynamically. By choosing BPF_PROG_TYPE_LSM, the developer can attach eBPF programs to LSM hooks, allowing them to implement custom security policies without patching or rebuilding the kernel.
The kernel’s security subsystem defines a variety of hooks for filesystem operations, network accesses, and system call checks. Attaching an LSM eBPF program means that whenever a protected operation occurs—such as opening a file, creating a socket, or executing a binary—the eBPF code runs to decide whether to permit or deny the action. This approach blends eBPF’s runtime adaptability with the kernel’s security framework.
A straightforward example might be a scenario where a particular container should never read from a certain sensitive file or directory. By attaching an LSM eBPF program to the relevant file-open hook, the system can block any open attempts that violate this policy. If conditions change (say the file’s allowed access pattern must be updated), the administrator can simply update the eBPF map or reload the LSM program. This transforms what was once a static policy configuration into a dynamic, code-driven security model.
BPF_PROG_TYPE_NETFILTER
Netfilter is the framework underlying most Linux firewall and NAT functionalities. Historically configured via iptables or nftables, Netfilter provides hooks at various stages of packet traversal within the kernel’s networking stack. By writing a NETFILTER type eBPF program, the developer can plug into these hooks and implement dynamic, programmable firewall rules and packet handling logic.
In kernel source code, netfilter hooks are spread across the net/ipv4, net/ipv6, and net/netfilter directories. Attaching an eBPF program at these hooks allows rewriting packets, filtering them according to complex criteria, or even performing custom NAT logic. Unlike static Netfilter rules, which rely on limited matching conditions and actions, an eBPF NETFILTER program can execute arbitrary logic, consult eBPF maps for dynamically updated policies, and integrate seamlessly with other eBPF components like XDP or cgroup hooks.
For instance, a complex multi-tenant environment might require distinct firewall policies per tenant that evolve as services change. By storing these policies in maps and using a NETFILTER eBPF program, the operator can update them at runtime, achieving a level of flexibility and programmability that static rules cannot offer. As the kernel continues to integrate eBPF more deeply into its subsystems, NETFILTER type programs are poised to become a powerful complement or even replacement for traditional firewall configurations.
We don’t need to explain the Attach Types because they are abstracted away when using libbpf. It automatically sets the proper attachment based on the program type and ELF section name.
Don’t worry if you don’t fully understand everything just yet or can’t see the big picture—by working through the examples in the next chapter, the concepts will become much clearer. We will explore practical examples of eBPF programs and their interaction with various kernel events, demonstrating how to apply the concepts we’ve covered and providing hands-on experience with attaching eBPF programs to real-world events.