📖 Engineering Everything with eBPF is available to read online here, or you can download the PDF for offline access.
This is the multi-page printable view of this section. Click here to print.
© 2025 Hamza Megahed – Engineering Everything with eBPF
License: Creative Commons Attribution 4.0 International (CC BY 4.0)
This license lets anyone copy, redistribute, remix, transform, and build upon the material for any purpose—even commercially—so long as they give appropriate credit and indicate if changes were made.

| Part of the project | License |
|---|---|
| Kernel-space eBPF examples | GPL-2.0-or-later |
| User-space loaders, scripts, utilities | Apache 2.0 |
| Book text & figures | CC BY 4.0 (this page) |
Running eBPF programs generally requires root access or the CAP_BPF capability. The kernel verifier guards against crashes, but inefficient or incorrectly attached programs can still degrade performance or disrupt networking. Test all examples on a non-production system first. Neither the author shall be liable for any damages arising from the use of this material.
Running eBPF programs requires elevated privileges and can affect system stability. Follow the examples at your own risk. Neither the author nor the publisher shall be liable for any damages arising from the use of this material.
Hello and welcome. Engineering Everything with eBPF is your friendly guide to eBPF on Linux. eBPF lets you run tiny programs inside the kernel so you can watch what the system is doing, filter network traffic, and even add safety checks—all without changing kernel source code. That sounds powerful, and it is. But it can also feel confusing the first time you see strange section names like SEC("xdp") or long helper calls. Do not worry. Every chapter walks you through one small idea at a time, then shows a real example working on your own machine.
Why this book exists
When I began learning eBPF, I kept bouncing between blog posts and mailing-list threads, piecing things together. I wrote Engineering Everything with eBPF so you do not have to repeat that maze. You will start by loading a five-line program, see the result right away, and gradually build up to practical tools for tracing disk I/O, shaping network traffic, and securing containers.
Plain language, lots of examples
I use short sentences, clear words, and plenty of code. Each new term—map, verifier, tail call—appears next to a tiny program you can copy, run, and explore. After you run the code, the explanation will make more sense. If something still feels cloudy, keep reading; later chapters revisit the idea from a different angle.
Tested environment
All code listings were compiled and executed on Linux kernel 6.12.22, with Clang/LLVM 17 and libbpf 1.5. If you use this kernel (or a newer one) the examples should work exactly as printed. When newer kernels add handy helpers or map types, I point them out and tell you whether you need to adjust your code.
Every example used in this book lives in the public repository
https://github.com/Hamza-Megahed/Engineering-Everything-with-eBPF-Code
What you need
clang, lld, make, and typical build toolsCAP_BPF capability) to load programsHow to read
Skim first, run later. Browse the chapter, copy the program, run it, then come back and read the full explanation. Learning speeds up when you see the output with your own eyes. If a term is still unclear, do not worry; it often becomes obvious after the next example.
By the final chapter you will have a small toolbox of eBPF programs you can adapt to real-world tasks—debugging, performance tuning, or keeping a service safe. Take your time, run the code, and enjoy the process. Everything will click, step by step. Let’s begin our journey into eBPF together.
We’re happy you want to make Engineering Everything with eBPF better.
The steps below keep changes smooth and easy.
Open an issue first
Fork the repo and create a branch
fix-ringbuf-example or add-cgroup-section.Write in the same simple style
```c for C, ```bash for shell).Test what you add
Open a pull request
Fixes #123).Review process
Licensing
char LICENSE[] SEC("license") = "GPL";
"BSD", "MIT", or any SPDX-compatible identifier if you prefer a more permissive license.
Code of Conduct
eBPF (Extended Berkeley Packet Filter) is a revolutionary in-kernel virtual machine that allows developers to execute custom programs directly within the Linux kernel. Unlike traditional approaches, which require recompiling or modifying the kernel, eBPF enables the dynamic injection of code, providing a safe and efficient way to extend kernel functionality without rebooting the system.
eBPF programs are typically written in a restricted subset of C, compiled into bytecode, and then loaded into the kernel using the bpf() system call (which will be explained in more detail later). Once loaded, these programs can be attached to various hooks or events within the kernel, such as system calls, network packets, and tracepoints. The execution of eBPF programs is governed by strict safety checks to prevent them from crashing the kernel or accessing unauthorized memory areas.
In simpler terms, think of eBPF as a sandboxed virtual machine inside the kernel that can observe and modify system behavior safely and efficiently. This technology has opened up new possibilities for performance monitoring, networking enhancements, and security enforcement.
Tracing: eBPF provides powerful tracing capabilities that allow developers to observe and analyze the behavior of the kernel and user-space applications. By attaching eBPF programs to tracepoints, kprobes (kernel probes), and uprobes (user-space probes), you can gather detailed insights into system performance and diagnose issues in real-time (which will be explained later).
open() system call tracepoint and prints the filename each time a file is opened. In cybersecurity, it helps detect unauthorized file access, enabling early threat detection and compliance monitoring.Networking: eBPF enables advanced networking features by allowing custom packet filtering, modification, and routing logic to run within the kernel. This eliminates the need to copy packets to user space, reducing latency and improving performance.
Security: eBPF enhances system security by allowing real-time monitoring and enforcement of security policies. With eBPF, you can detect and respond to security events, such as unauthorized system calls or suspicious network activity.
Observability: eBPF provides deep observability into system behavior by allowing the collection of detailed telemetry data. Unlike traditional logging and metrics, eBPF-based observability can capture low-level events without requiring changes to application code.
bcc (BPF Compiler Collection) and bpftrace allow you to profile CPU usage, memory access, and I/O operations in real-time, helping to identify performance bottlenecks and optimize system performance. In cybersecurity, this can be used to monitor for anomalous system behavior, such as unusual CPU spikes or memory access patterns, which could indicate a malware infection or unauthorized activities.Don’t worry if some of these concepts seem challenging right now; we’ll break them down with clear examples throughout the book. Now, let’s dive into the history of eBPF.
The origins of eBPF (extended Berkeley Packet Filter) trace back to its predecessor, the Berkeley Packet Filter (BPF). BPF was first introduced in 1992 by Steven McCanne and Van Jacobson at the Lawrence Berkeley Laboratory. It was designed to provide a high-performance, user-programmable packet filtering mechanism for network monitoring tools, particularly for capturing packets in real-time.
Prior to BPF, packet capturing was inefficient due to the need for constant context switching between the kernel and user space. The kernel would pass every network packet to user space, where filtering decisions were made. This approach led to significant overhead. BPF addressed this problem by enabling the execution of filtering programs directly within the kernel, allowing only relevant packets to be passed to user space. This dramatically improved performance and efficiency.
Classic BPF, often referred to as cBPF worked by allowing users to write simple programs to filter network traffic based on specific patterns. These programs were expressed as sequences of low-level instructions that the BPF virtual machine (VM) running in the kernel could interpret and execute. The most notable tool that leveraged cBPF was tcpdump, which allowed network administrators to capture and analyze network packets effectively.
Despite its efficiency, cBPF had several limitations:
BPF was first integrated into the Linux kernel in 1997, starting from version 2.1. This integration allowed kernel-level packet filtering for tools like tcpdump and iptables. Over time, the BPF VM became a reliable mechanism for filtering network traffic efficiently within the kernel space. However, as system and network performance demands grew, the limitations of classic BPF became more clear. The need for a more powerful, flexible, and extensible version of BPF led to the development of eBPF.
In 2014, the Linux kernel version 3.18 introduced extended BPF (eBPF). eBPF was a significant enhancement over classic BPF, providing a modern, flexible, and powerful framework for executing user-defined programs within the kernel. The key improvements introduced by eBPF include:
Since its introduction, eBPF has evolved rapidly, with continuous enhancements to its feature set and performance. Projects like bcc (BPF Compiler Collection), bpftool, and libbpf have made writing and deploying eBPF programs more accessible. eBPF is now used extensively for networking, observability, and security tasks in major projects like Cilium, Falco, and the Kubernetes ecosystem.
The terminology surrounding BPF and eBPF often leads to confusion due to the historical evolution of the technology. Originally, BPF referred exclusively to the Berkeley Packet Filter designed for packet capture. However, with the introduction of eBPF in 2014, the technology evolved far beyond its initial purpose, supporting tasks like tracing, performance monitoring, and security.
Despite these advancements, many tools and kernel APIs continue to use the term BPF even when referring to eBPF functionality. For example, commands like bpftool and the bpf() system call refer to eBPF features while retaining the older name. This overlap in terminology can cause misunderstandings, especially for newcomers who may not be aware of the differences between classic BPF and modern eBPF.
To avoid confusion, it’s helpful to use BPF when referring to the original packet-filtering technology and eBPF when discussing the extended capabilities introduced in the modern framework. This distinction clarifies communication and ensures a better understanding of the technology’s capabilities in the Linux ecosystem.
To illustrate classic BPF in action, consider a simple tcpdump command that captures only TCP traffic on port 80 (HTTP):
tcpdump -i eth0 'ip and tcp port 80'
This command filters packets to capture only those that are TCP-based and are using port 80. The underlying BPF bytecode generated by this command can be viewed using the -d flag:
tcpdump -i eth0 -d 'ip and tcp port 80 tcp port 80'
The output might look like this:
(000) ldh      [12]
(001) jeq      #0x800           jt 2    jf 12
(002) ldb      [23]
(003) jeq      #0x6             jt 4    jf 12
(004) ldh      [20]
(005) jset     #0x1fff          jt 12   jf 6
(006) ldxb     4*([14]&0xf)
(007) ldh      [x + 14]
(008) jeq      #0x50            jt 11   jf 9
(009) ldh      [x + 16]
(010) jeq      #0x50            jt 11   jf 12
(011) ret      #262144
(012) ret      #0
Before diving into the example, take a moment to review the following diagram of the Ethernet, IP, and TCP headers. This will help you visualize how the packet is structured, making it easier to follow along with each step in the BPF bytecode. Keep this scheme in mind as we go through the example to understand how each instruction maps to specific parts of the packet.
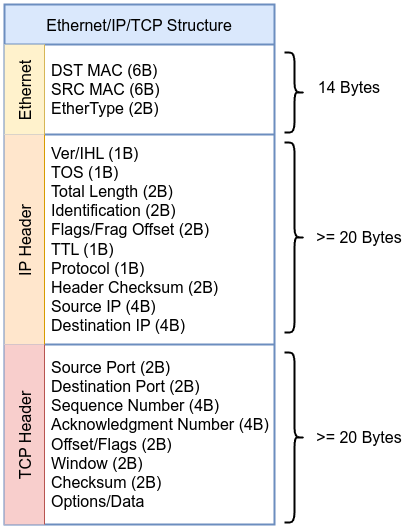
Here’s the breakdown of each instruction, including the relevant source code location and snippets from the Linux kernel where these actions are defined or represented.
Instruction 000 ldh [12]: Load the 16-bit EtherType field at offset 12 in the packet as described in the kernel source code include/uapi/linux/if_ether.h
#define ETH_HLEN 14          /* Total Ethernet header length */
#define ETH_P_IP 0x0800      /* IPv4 EtherType */
Instruction 001 jeq #0x800 jt 2 jf 12: If the EtherType is 0x800 (IPv4), jump to instruction 2; otherwise, jump to instruction 12.
Instruction 002 ldb [23]: Load the 8-bit protocol field at offset 23 in the IP header.
Instruction 003 jeq #0x6 jt 4 jf 12: If the protocol is 6 (TCP), jump to instruction 4; otherwise, jump to instruction 12 as described in the kernel source code include/uapi/linux/in.h
#define IPPROTO_TCP 6 /* Transmission Control Protocol */
Instruction 004: ldh [20]: Load the 16-bit TCP source port at offset 20.
Instruction 005: jset #0x1fff jt 12 jf 6: Check if the lower 13 bits of the TCP header are non-zero; if true, jump to instruction 12; otherwise, jump to instruction 6.
Instruction 006: ldxb 4*([14]&0xf): Load the value in the TCP header, adjusting by scaling based on the value in the IP header.
Instruction 007: ldh [x + 14]: Load the TCP destination port, located at offset 14 from the start of the packet.
Instruction 008: jeq #0x50 jt 11 jf 9: If the destination port is 80 (0x50 in hexadecimal), jump to instruction 11; otherwise, jump to instruction 9.
Instruction 009: ldh [x + 16]: Load the TCP source port, located at offset 16 from the start of the packet.
Instruction 010: jeq #0x50 jt 11 jf 12: If the source port is 80 (0x50), jump to instruction 11; otherwise, jump to instruction 12.
Instruction 011: ret #262144: If all conditions match, capture the packet (return the packet length).
Instruction 012: ret #0: If the conditions do not match, drop the packet.
These instructions illustrate a classic BPF packet filter that matches IPv4 and TCP traffic on port 80 (HTTP). The constants and structures provided are standard definitions in the Linux kernel. This bytecode demonstrates how classic BPF allows efficient filtering by executing a series of low-level instructions directly in the kernel.
80. Without explicitly defining both ports, the filter would not distinguish between source and destination ports, simplifying the bytecode. These additional checks ensure that packets using port 80 in either direction are captured.
Let’s explore the differences between classic BPF and eBPF to better understand the enhanced capabilities of eBPF.
As mentioned, Berkeley Packet Filter (BPF) was originally developed to filter network packets efficiently. It enabled in-kernel filtering of packets based on simple criteria. However, as the need for more versatile and performant filtering and monitoring grew, extended BPF (eBPF) emerged as a powerful evolution. eBPF transforms BPF into a general-purpose execution engine within the kernel, providing significantly more flexibility and efficiency.
The following 6 points explores the key differences between eBPF and classic BPF, based on Kernel Documentation.
Classic BPF is primarily used for packet filtering. Its primary use case is in network monitoring tools like tcpdump, where it allows users to specify packet filtering rules directly within the kernel.
eBPF, however, has vastly expanded use cases. eBPF is used in:
Classic BPF has a very limited instruction set, primarily designed for basic operations like loading data, performing simple arithmetic, jumping, and returning values.
eBPF, in contrast, expands the instruction set significantly. It introduces new operations like:
Additionally, eBPF supports 64-bit operations (via BPF_ALU64) and atomic operations like BPF_XADD, enabling more sophisticated processing directly in the kernel.
Classic BPF only has two registers (A and X), with limited memory and stack space. The operations on data are simple and restricted to 32-bit width, and these registers are manipulated with specific instructions that limit flexibility.
eBPF greatly improves on this by expanding the number of registers from 2 to 10. eBPF’s calling conventions are designed for high efficiency, utilizing registers (R1-R5) to pass arguments directly into the kernel functions. After the function call, registers R1-R5 are reset, and R0 holds the return value.This allows for more complex operations and handling of more data. Registers in eBPF are also 64-bit wide, which enables direct mapping to hardware registers on modern 64-bit processors. This wider register set and the introduction of a read-only frame pointer (R10) allow eBPF to handle more complex operations like function calls with multiple arguments and results.
Classic BPF is interpreted by the kernel, This means the kernel would read and execute each instruction one by one which adds overhead to the execution of each instruction. This can be a limiting factor when performing more complex operations or filtering on high-throughput systems.
eBPF is designed with Just-In-Time (JIT) compilation in mind, meaning that eBPF programs can be translated into optimized native machine code at runtime. The JIT compiler can convert eBPF bytecode to highly efficient machine instructions, reducing the overhead significantly. This allows eBPF programs to perform at speeds comparable to native code execution, even for complex tasks like system call filtering and network traffic analysis.
Classic BPF uses a simple verifier that checks for program safety by ensuring there are no errors like out-of-bounds memory access.
eBPF, on the other hand, includes a more sophisticated verifier that ensures the program complies to a set of strict rules before execution. The verifier checks for issues like:
This makes eBPF programs much safer, even when they are running with elevated privileges or performing sensitive tasks in the kernel.
Classic BPF: The original BPF format had a program size limit of 4096 instructions, and programs had to be very efficient to avoid exceeding this limit. The limited number of registers and operations meant that programs were usually simple and short.
eBPF: While eBPF still retains a 4096 instruction limit for kernels before 5.2 and one million instructions for kernel starting from 5.2, its expanded instruction set and register size allow for significantly more complex programs. Additionally, the eBPF verifier ensures that programs are safe, loop-free, and deterministic. Furthermore, there are restrictions on the number of arguments that can be passed to kernel functions (currently up to five), although these can be relaxed in future versions of eBPF. Tail calls also allow chaining multiple eBPF programs together, effectively extending the overall execution beyond the single-program instruction limit.
Now, let’s dive into real-world examples to see how eBPF is applied in action and understand its practical benefits.
Netflix relies heavily on maintaining a high level of performance and reliability for its massive streaming infrastructure. With millions of users accessing content simultaneously, identifying performance bottlenecks and ensuring smooth streaming is critical. To address these challenges, Netflix leverages eBPF for advanced performance tracing and debugging.
eBPF allows Netflix engineers to dynamically instrument production systems to gain real-time insights into various kernel and application-level events without impacting system performance. Tools like BPFtrace and bcc (BPF Compiler Collection) help trace everything from CPU utilization to memory allocation and disk I/O latency. eBPF enables the monitoring of these metrics without requiring code modifications or system restarts, providing a seamless debugging experience.
One of the key benefits for Netflix is the ability to analyze issues in real time. When a problem arises, engineers can deploy eBPF-based tracing programs to identify the root cause immediately. This minimizes downtime and ensures rapid resolution. For example, if a particular server experiences unexpected delays, eBPF can quickly pinpoint whether the issue stems from the network stack, disk latency, or a CPU bottleneck.
Moreover, eBPF’s low overhead makes it suitable for use in high-traffic production environments. Unlike traditional tracing tools, which often introduce performance degradation, eBPF maintains efficiency while providing deep insights. This combination of power and performance helps Netflix maintain the quality of service users expect.
Facebook (now Meta) handles billions of user interactions daily, requiring robust and efficient load-balancing mechanisms. To achieve this, Facebook developed Katran, a high-performance, eBPF-based layer 4 load balancer. Katran powers the edge network for Facebook’s backend services, providing scalable and reliable traffic distribution.
Katran uses XDP eBPF to offload load-balancing tasks to the Linux kernel, bypassing some of the traditional limitations of user-space load balancers. By running directly in the kernel, eBPF ensures that packet processing is both fast and efficient, reducing the need for context switches and avoiding bottlenecks.
A key feature of Katran is its ability to dynamically adapt to changes in traffic patterns. eBPF programs enable the load balancer to update its forwarding rules on the fly without requiring restarts. This dynamic updating capability ensures minimal disruption and allows Facebook to handle sudden traffic surges smoothly.
Cloudflare provides security and performance services to millions of websites worldwide, making it a prime target for Distributed Denial of Service (DDoS) attacks. To protect against these attacks, Cloudflare uses XDP eBPF to enhance its DDoS mitigation capabilities.
eBPF enables Cloudflare to monitor network traffic in real time, identifying and filtering out malicious packets before they reach the application layer. By deploying eBPF programs directly in the kernel, Cloudflare can analyze packet headers, track connection states, and enforce filtering rules with minimal latency.
One advantage of using eBPF for DDoS mitigation is its flexibility. eBPF allows Cloudflare to update filtering logic dynamically, adapting to new attack vectors without requiring system downtime or restarts. For example, when a new type of DDoS attack is identified, Cloudflare can deploy an updated eBPF filter to block the attack within seconds.
Moreover, eBPF’s performance efficiency ensures that mitigation measures do not degrade legitimate traffic. Cloudflare can maintain high throughput and low latency even when under attack, providing a seamless experience for end users.
eBPF offers a range of benefits that make it an attractive choice for organizations looking to improve performance, security, and flexibility in their systems. Here are some key reasons to use eBPF:
eBPF programs run directly in the kernel, avoiding the performance penalties associated with user-space operations. With Just-In-Time (JIT) compilation, eBPF code is translated into efficient machine code, ensuring minimal latency and high throughput. This makes eBPF suitable for performance-critical applications like load balancing, packet filtering, and tracing.
eBPF’s flexibility allows it to be used across various domains, including:
This flexibility allows organizations to implement a wide range of solutions without needing different tools for each use case.
eBPF enhances security by enabling real-time policy enforcement and providing deep visibility into system behavior. The eBPF verifier ensures that programs are safe to run, preventing harmful or insecure code from affecting the kernel. This safety mechanism reduces the risk of vulnerabilities and exploits.
One of eBPF’s standout features is its ability to update functionality dynamically. Whether for tracing, load balancing, or security filtering, eBPF programs can be modified and reloaded without rebooting the system. This ensures minimal downtime and enables rapid responses to changing conditions.
eBPF provides powerful tools for real-time observability. By attaching eBPF programs to various kernel and user-space events, organizations can gain detailed insights into system behavior, identify bottlenecks, and troubleshoot issues quickly.
While eBPF programs are highly portable across different Linux distributions, their portability can be affected by variations in kernel versions, architectures, and the available helper functions. The eBPF subsystem in the kernel provides a consistent foundation, but certain kernel updates or changes in architecture may introduce new features or limitations that require modifications to the eBPF programs. Despite these potential variations, eBPF still offers a relatively high degree of portability for cloud-based applications and large-scale environments, allowing organizations to deploy solutions across diverse systems with minimal overhead, provided that compatibility is taken into account.
Now that we’ve explored the general benefits of eBPF, let’s take a closer look at how these advantages specifically apply to the realm of cybersecurity.
eBPF’s capabilities make it a powerful tool for enhancing cybersecurity across multiple layers of infrastructure. By operating within the kernel, eBPF can monitor, analyze, and enforce security policies with low latency and high efficiency. This ability to operate in real time gives organizations a crucial edge in protecting against modern cyber threats.
eBPF enables deep inspection of network traffic and system calls, allowing for real-time detection of anomalous behavior. Organizations can use eBPF to build intrusion detection and prevention systems (IDS/IPS) that identify and block malicious activities such as SQL injection, malware payloads, and privilege escalation attempts. eBPF’s ability to analyze packets at the kernel level ensures minimal overhead while maintaining thorough security checks.
eBPF’s flexibility allows for rapid deployment of filters to block DDoS traffic patterns. When an attack is detected, eBPF programs can be dynamically updated to mitigate new attack vectors in real time. This adaptive capability ensures continuous protection without service disruption.
eBPF can enforce security policies at runtime by monitoring system calls and blocking unauthorized actions. For instance, if a process attempts to access restricted files or execute suspicious operations, eBPF can intervene immediately to block the action and alert administrators. This helps mitigate insider threats and potential exploits.
By attaching eBPF probes to system processes and kernel functions, organizations can monitor for integrity violations. eBPF can detect unauthorized modifications to critical processes (such as injecting code into a running process) or kernel structures, providing an additional layer of defense against cyber attacks.
eBPF can integrate with threat intelligence platforms to apply real-time security updates. For example, new threat indicators can be deployed as eBPF filters to block known malicious IP addresses, domains, or file hashes. This real-time enforcement capability helps organizations stay ahead of evolving threats.
In summary, eBPF’s combination of real-time monitoring, dynamic policy enforcement, and low-latency execution makes it a cornerstone for modern cybersecurity strategies. It could empowers organizations to defend against cyber threats while maintaining performance and system integrity.
Don’t worry if this all feels a bit abstract right now—throughout the next chapters, we’ll dive into specific examples that illustrate how eBPF can be applied to these cybersecurity challenges.
Now that we’ve seen how eBPF can enhance cybersecurity, let’s take a closer look at its architecture, which enables these powerful capabilities.
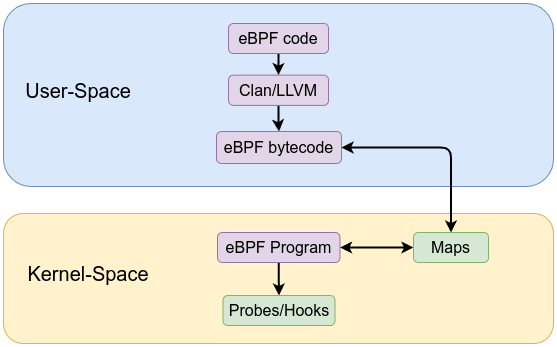
The eBPF architecture is both simple—through its rigid instruction set, maps, and helpers—and sophisticated—via the verifier, JIT, and integration points. At a high level, it is a pipeline taking user-space defined logic through a safety check and into the kernel’s execution environment. At a deep level, each component (verifier, maps, JIT) enforces strict rules that guarantee the kernel’s stability and performance. Through this layered design, eBPF achieves a rare combination: the ability to safely run custom code inside the kernel at near-native speeds while maintaining robust security and reliability guarantees.
Some of the following may not be clear to you yet, as each component will be explained in more detail in the following chapters.
A high-level view of the architecture:
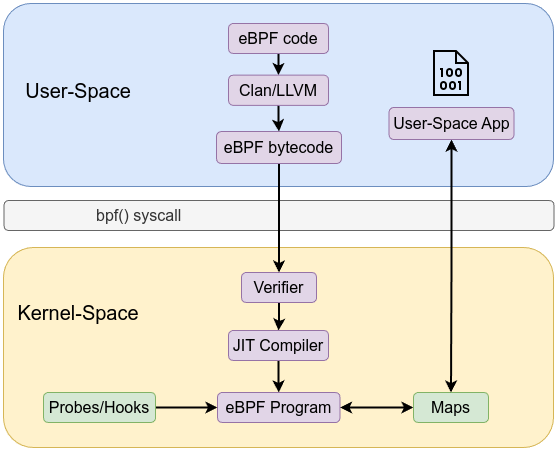
User space tooling compiles and loads these eBPF programs. For example, Clang/LLVM: Compiles C (or other) source code to eBPF bytecode using a special -target bpf flag. The workflow is similar to the following:
bpf() system calls via libbpf or bpftool to load the bytecode into the kernel.This pipeline ensures a controlled, step-by-step process from user space into the kernel.
Before an eBPF program runs, it must pass through a static verifier that analyzes every possible execution path. The verifier ensures:
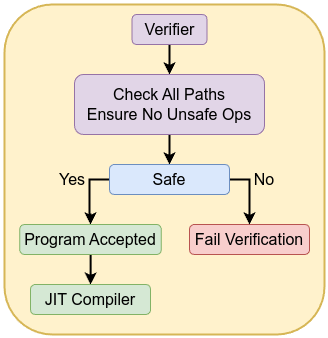
The verifier ensures that once a program is accepted, it cannot violate kernel integrity.
Once verified, eBPF bytecode can be interpreted by an in-kernel virtual machine, or just-in-time compiled into native machine instructions. The JIT compiler:
This makes eBPF suitable for performance-critical tasks, such as packet processing at line rate with XDP (eXpress Data Path).
eBPF programs are executed when certain kernel events occur. These events are known as hook points. Common hook points include:
Each hook provides a context—a structured pointer to data relevant to that event (e.g., packet metadata, process info). The program reads fields from this context within verifier-approved bounds, making decisions based on current state.
Maps are the primary mechanism for storing and sharing state between eBPF programs and user space. They enable persistent data storage, counters, histograms, or lookup tables that eBPF code can use at runtime.
The verifier knows the properties of each map and ensures all access is safe (e.g., correct key size, no out-of-bounds reads). This static knowledge allows for safe data sharing between eBPF and user space.
Don’t worry if you don’t fully understand all the details yet—this is completely normal! As we go through applied examples, each step of the architecture will become much clearer, and you’ll be able to see how everything fits together in practice.
The bpf() system call serves as a central mechanism in the Linux kernel for working with the Extended Berkeley Packet Filter (eBPF) subsystem. Originally introduced as a tool to filter packets in the kernel’s networking stack, Berkeley Packet Filters (BPF) allowed user space to define small programs that run efficiently in kernel space. Over time, this concept has evolved significantly from classic BPF (cBPF) to extended BPF (eBPF), which unlocks a far richer set of capabilities. The extended model supports versatile data structures, the ability to attach programs to a variety of kernel subsystems, and the invocation of helper functions that simplify complex operations.
The bpf() system call accepts a command argument determining the exact operation to be performed, and a corresponding attribute structure that passes parameters specific to that operation. Among these operations are commands to load eBPF programs into the kernel, create and manage eBPF maps, attach programs to hooks, and query or manipulate existing eBPF objects. This wide range of functionality makes bpf() a cornerstone of eBPF-based tooling in modern Linux systems.
The kernel ensures eBPF programs cannot crash or destabilize the system through rigorous static analysis at load time. As a result, the bpf() system call provides a secure yet flexible interface for extending kernel functionality.
In the /include/uapi/linux/bpf.h header file, you will find a list of all the commands used in the bpf() syscall. These commands define the actions that can be performed on eBPF objects, such as loading programs, creating maps, attaching programs to kernel events, and more. The commands are organized as part of the enum bpf_cmd, which is used as an argument to specify the desired operation when invoking the bpf() syscall.
Here’s an example of how the enum bpf_cmd is defined in the kernel source:
enum bpf_cmd {
	BPF_MAP_CREATE,
	BPF_MAP_LOOKUP_ELEM,
	BPF_MAP_UPDATE_ELEM,
	BPF_MAP_DELETE_ELEM,
	BPF_MAP_GET_NEXT_KEY,
	BPF_PROG_LOAD,
	BPF_OBJ_PIN,
	BPF_OBJ_GET,
	BPF_PROG_ATTACH,
	BPF_PROG_DETACH,
	BPF_PROG_TEST_RUN,
	BPF_PROG_RUN = BPF_PROG_TEST_RUN,
	BPF_PROG_GET_NEXT_ID,
	BPF_MAP_GET_NEXT_ID,
	BPF_PROG_GET_FD_BY_ID,
	BPF_MAP_GET_FD_BY_ID,
	BPF_OBJ_GET_INFO_BY_FD,
	BPF_PROG_QUERY,
	BPF_RAW_TRACEPOINT_OPEN,
	BPF_BTF_LOAD,
	BPF_BTF_GET_FD_BY_ID,
	BPF_TASK_FD_QUERY,
	BPF_MAP_LOOKUP_AND_DELETE_ELEM,
	BPF_MAP_FREEZE,
	BPF_BTF_GET_NEXT_ID,
	BPF_MAP_LOOKUP_BATCH,
	BPF_MAP_LOOKUP_AND_DELETE_BATCH,
	BPF_MAP_UPDATE_BATCH,
	BPF_MAP_DELETE_BATCH,
	BPF_LINK_CREATE,
	BPF_LINK_UPDATE,
	BPF_LINK_GET_FD_BY_ID,
	BPF_LINK_GET_NEXT_ID,
	BPF_ENABLE_STATS,
	BPF_ITER_CREATE,
	BPF_LINK_DETACH,
	BPF_PROG_BIND_MAP,
	BPF_TOKEN_CREATE,
	__MAX_BPF_CMD,
};
We are not going through the full list but among these commands, one of the most important is bpf_prog_load. This command is used to load an eBPF program into the kernel. By invoking bpf() with the BPF_PROG_LOAD command, the kernel verifies the program’s safety, ensuring that it won’t cause any harm to the system. Upon success, the program is loaded into the kernel, and the system call returns a file descriptor associated with this eBPF program, allowing the program to be attached to various kernel events or subsystems, such as network interfaces, tracepoints, or XDP.
In the kernel’s BPF subsystem, specifically in kernel/bpf/syscall.c, a switch statement is used to dispatch commands defined by the enum bpf_cmd to their corresponding handler functions.
	switch (cmd) {
	case BPF_MAP_CREATE:
		err = map_create(&attr);
		break;
	case BPF_MAP_LOOKUP_ELEM:
		err = map_lookup_elem(&attr);
		break;
	case BPF_MAP_UPDATE_ELEM:
		err = map_update_elem(&attr, uattr);
		break;
	case BPF_MAP_DELETE_ELEM:
		err = map_delete_elem(&attr, uattr);
		break;
	case BPF_MAP_GET_NEXT_KEY:
		err = map_get_next_key(&attr);
		break;
	case BPF_MAP_FREEZE:
		err = map_freeze(&attr);
		break;
	case BPF_PROG_LOAD:
		err = bpf_prog_load(&attr, uattr, size);
		break;
	[...]
Now, let’s take a closer look at how bpf_prog_load works in practice and how eBPF programs can be loaded into the kernel.
As outlined in man 2 bpf, the bpf_prog_load operation is used to load an eBPF program into the Linux kernel via the bpf() syscall. When successful, this operation returns a new file descriptor associated with the loaded eBPF program. This file descriptor can then be used for operations such as attaching the program to specific kernel events (e.g., networking, tracing), checking its status, or even unloading it when necessary. The BPF_PROG_LOAD operation is invoked through the bpf() syscall to load the eBPF program into the kernel.
char bpf_log_buf[LOG_BUF_SIZE];

int bpf_prog_load(enum bpf_prog_type type,
                  const struct bpf_insn *insns, int insn_cnt,
                  const char *license)
{
    union bpf_attr attr = {
        .prog_type = type,
        .insns = ptr_to_u64(insns),
        .insn_cnt = insn_cnt,
        .license = ptr_to_u64(license),
        .log_buf = ptr_to_u64(bpf_log_buf),
        .log_size = LOG_BUF_SIZE,
        .log_level = 1,
    };

    return bpf(BPF_PROG_LOAD, &attr, sizeof(attr));
}
Key Parameters:
prog_type: Specifies the type of eBPF program (e.g., BPF_PROG_TYPE_XDP, BPF_PROG_TYPE_KPROBE).insns: The array of eBPF instructions (bytecode) that the program consists of.insn_cnt: The number of instructions in the insns array.license: This attribute specifies the license under which the eBPF program is distributed. It is important for ensuring compatibility with kernel helper functions that are GPL-only. Some eBPF helpers are restricted to being used only in programs that have a GPL-compatible license. Examples of such licenses include “GPL”, “GPL v2”, or “Dual BSD/GPL”. If the program’s license is not compatible with the GPL, it may not be allowed to invoke these specific helper functions.log_buf: A buffer where the kernel stores the verification log if the program fails verification.log_size: The size of the verification log buffer.When a user-space process issues a BPF_PROG_LOAD command, the kernel invokes the bpf_prog_load(&attr, uattr, size) function which is defined in kernel/bpf/syscall.c kernel source code:
static int bpf_prog_load(union bpf_attr *attr, bpfptr_t uattr, u32 uattr_size)
{
	enum bpf_prog_type type = attr->prog_type;
	struct bpf_prog *prog, *dst_prog = NULL;
	struct btf *attach_btf = NULL;
	struct bpf_token *token = NULL;
	bool bpf_cap;
	int err;
	char license[128];

    [...]
To simplify working with eBPF programs, libbpf provides the bpf_prog_load() function, which abstracts the complexity of interacting with the kernel via the bpf() syscall. This wrapper is located in /tools/lib/bpf/bpf.c and provides additional functionality like retrying failed program loads and setting detailed log options.
int bpf_prog_load(enum bpf_prog_type prog_type,
                  const char *prog_name, const char *license,
                  const struct bpf_insn *insns, size_t insn_cnt,
                  struct bpf_prog_load_opts *opts)
This function simplifies the process of loading eBPF programs by wrapping around the bpf() syscall, handling retries, and providing additional configuration options.
bpf_prog_load_opts structure: This structure provides additional configuration options when loading an eBPF program, as seen below:
struct bpf_prog_load_opts {
    size_t sz;                          // Size of this structure for compatibility
    int attempts;                        // Retry attempts if bpf() returns -EAGAIN
    enum bpf_attach_type expected_attach_type;  // Expected attachment type
    __u32 prog_btf_fd;                  // BTF file descriptor
    __u32 prog_flags;                   // Program flags
    __u32 prog_ifindex;                 // Interface index for programs like XDP
    __u32 kern_version;                  // Kernel version for compatibility
    const int *fd_array;                 // Array of file descriptors for attachments
    const void *func_info;               // Function info for BTF
    __u32 func_info_cnt;                 // Function info count
    __u32 func_info_rec_size;           // Function info record size
    const void *line_info;               // Line info for BTF
    __u32 line_info_cnt;                 // Line info count
    __u32 line_info_rec_size;           // Line info record size
    __u32 log_level;                    // Log verbosity for verifier logs
    __u32 log_size;                     // Log buffer size
    char *log_buf;                      // Log buffer
    __u32 log_true_size;                // Actual log size
    __u32 token_fd;                     // Token file descriptor (optional)
    __u32 fd_array_cnt;                 // Length of fd_array
    size_t :0;                          // Padding for compatibility
};
At the heart of eBPF lies the concept of eBPF maps. Maps are generic, dynamic, kernel-resident data structures accessible from both eBPF programs and user space applications. They allow you to share state and pass information between user space and eBPF code.
The Linux man page (man 2 bpf) states:
eBPF maps are a generic data structure for storage of different data types. Data types are generally treated as binary blobs. A user just specifies the size of the key and the size of the value at map-creation time.
Now, let’s dive into the world of eBPF maps and explore how these powerful data structures are created, accessed, and used within the kernel. By understanding how to interact with maps, you’ll unlock the ability to efficiently store and retrieve data across different eBPF programs.
One of the key design elements that make eBPF so flexible and powerful is the concept of maps. An eBPF map is a data structure residing in the kernel, accessible both by eBPF programs and user space applications. Maps provide a stable way to share state, pass configuration or lookup data, store metrics, and build more complex logic around kernel events.
Unlike traditional kernel data structures, eBPF maps are created, managed, and destroyed via well-defined syscalls and helper functions. They offer a form of persistent kernel memory to eBPF programs, ensuring that data can outlast a single function call or event. This allows administrators and developers to build sophisticated tools for tracing, networking, security, performance monitoring, and more—without modifying or recompiling the kernel.
The Linux kernel defines numerous map types (more than 30 as of this writing), each optimized for different use cases. Some store generic key-value pairs, others store arrays or are used specifically for attaching events, referencing other maps, or implementing special data structures like tries. Choosing the right map type depends on the data and the operations you need to perform.
Before we start with explaining eBPF maps, we need to install either gcc or clang, along with libbpf-dev, to compile our examples. These tools are essential for building and linking the necessary components for eBPF programs. On Debian and Ubuntu, you can install them using the following command:
sudo apt install gcc libbpf-dev
Below, we explore ten commonly used eBPF map types, detailing their conceptual purpose, common use cases, and providing code snippets demonstrating their creation using the bpf_create_map() API.
From the large collection defined in the kernel’s /include/uapi/linux/bpf.h,
enum bpf_map_type {
	BPF_MAP_TYPE_UNSPEC,
	BPF_MAP_TYPE_HASH,
	BPF_MAP_TYPE_ARRAY,
	BPF_MAP_TYPE_PROG_ARRAY,
	BPF_MAP_TYPE_PERF_EVENT_ARRAY,
	BPF_MAP_TYPE_PERCPU_HASH,
	BPF_MAP_TYPE_PERCPU_ARRAY,
	BPF_MAP_TYPE_STACK_TRACE,
	BPF_MAP_TYPE_CGROUP_ARRAY,
	BPF_MAP_TYPE_LRU_HASH,
	BPF_MAP_TYPE_LRU_PERCPU_HASH,
	BPF_MAP_TYPE_LPM_TRIE,
	BPF_MAP_TYPE_ARRAY_OF_MAPS,
	BPF_MAP_TYPE_HASH_OF_MAPS,
	BPF_MAP_TYPE_DEVMAP,
	BPF_MAP_TYPE_SOCKMAP,
	BPF_MAP_TYPE_CPUMAP,
	BPF_MAP_TYPE_XSKMAP,
	BPF_MAP_TYPE_SOCKHASH,
	BPF_MAP_TYPE_CGROUP_STORAGE_DEPRECATED,
	BPF_MAP_TYPE_CGROUP_STORAGE = BPF_MAP_TYPE_CGROUP_STORAGE_DEPRECATED,
	BPF_MAP_TYPE_REUSEPORT_SOCKARRAY,
	BPF_MAP_TYPE_PERCPU_CGROUP_STORAGE_DEPRECATED,
	BPF_MAP_TYPE_PERCPU_CGROUP_STORAGE = BPF_MAP_TYPE_PERCPU_CGROUP_STORAGE_DEPRECATED,
	BPF_MAP_TYPE_QUEUE,
	BPF_MAP_TYPE_STACK,
	BPF_MAP_TYPE_SK_STORAGE,
	BPF_MAP_TYPE_DEVMAP_HASH,
	BPF_MAP_TYPE_STRUCT_OPS,
	BPF_MAP_TYPE_RINGBUF,
	BPF_MAP_TYPE_INODE_STORAGE,
	BPF_MAP_TYPE_TASK_STORAGE,
	BPF_MAP_TYPE_BLOOM_FILTER,
	BPF_MAP_TYPE_USER_RINGBUF,
	BPF_MAP_TYPE_CGRP_STORAGE,
	BPF_MAP_TYPE_ARENA,
	__MAX_BPF_MAP_TYPE
};
we’ll focus on these ten map types:
These map types are either widely used or particularly illustrative of eBPF’s capabilities. Together, they represent a broad spectrum of data structures and functionalities.
In eBPF, there are two main components: the eBPF program (which runs in the kernel) and the user-space code (both components will be explained later). It is common to define maps in the eBPF program, but maps are actually created and managed in user-space using the bpf() syscall.
The eBPF program (kernel-side) defines how the map should look and how it will be used by the program. This definition specifies the map’s type, key size, value size, and other parameters. However, the actual creation of the map (allocating memory for it in the kernel and linking it to the eBPF program) occurs in user-space. This process involves invoking the bpf() syscall with the BPF_MAP_CREATE command.
In practice, BTF (BPF Type Format) style maps are the preferred method for defining maps in eBPF programs. Using BTF provides a more flexible, type-safe way to define maps and makes it easier to manage complex data structures. We will explain BTF (BPF Type Format) later in details. When a user-space process issues a BPF_MAP_CREATE command, the kernel invokes the map_create(&attr) function which look like the following:
static int map_create(union bpf_attr *attr)
{
	const struct bpf_map_ops *ops;
	struct bpf_token *token = NULL;
	int numa_node = bpf_map_attr_numa_node(attr);
	u32 map_type = attr->map_type;
	struct bpf_map *map;
	bool token_flag;
	int f_flags;
	[...]
The bpf_map_create() function is part of the libbpf library, which provides a user-space interface for interacting with eBPF in Linux. Internally, bpf_map_create() sets up the necessary parameters for creating an eBPF map and then makes a call to the bpf() syscall with the BPF_MAP_CREATE command. This function simplifies the process for the user by abstracting away the complexities of directly using the bpf() syscall. It configures the map, including its type, key size, value size, and the number of entries, and once these parameters are prepared, bpf_map_create() invokes the bpf() syscall with the BPF_MAP_CREATE command, instructing the kernel to create the eBPF map. In essence, bpf_map_create() serves as a user-friendly wrapper around the bpf() syscall’s BPF_MAP_CREATE command or map_create function, making it easier for user-space programs to create eBPF maps.
bpf_map_create() wrapper function is defined in the Kernel source code under tools/lib/bpf/bpf.c. The function prototype is as follows:
int bpf_map_create(enum bpf_map_type map_type,
                   const char *map_name,
                   __u32 key_size,
                   __u32 value_size,
                   __u32 max_entries,
                   const struct bpf_map_create_opts *opts);
map_type: Specifies the type of the map (e.g., BPF_MAP_TYPE_HASH).map_name: The name of the map.key_size: Size of the key in the map.value_size: Size of the value in the map.max_entries: Maximum number of entries the map can hold.opts: A pointer to the bpf_map_create_opts structure, which contains additional options for map creation (such as flags, BTF information, etc.).The definition for the bpf_map_create_opts structure, part of libbpf, can be found in /tools/lib/bpf/bpf.h
struct bpf_map_create_opts {
    size_t sz;                     /* Size of this struct for forward/backward compatibility */
    __u32 btf_fd;                  /* BTF (BPF Type Format) file descriptor for type information */
    __u32 btf_key_type_id;         /* BTF key type ID for the map */
    __u32 btf_value_type_id;       /* BTF value type ID for the map */
    __u32 btf_vmlinux_value_type_id; /* BTF vmlinux value type ID for maps */
    __u32 inner_map_fd;            /* File descriptor for an inner map (for nested maps) */
    __u32 map_flags;               /* Flags for the map (e.g., read-only, etc.) */
    __u64 map_extra;               /* Extra space for future expansion or additional settings */
    __u32 numa_node;               /* NUMA node to assign the map */
    __u32 map_ifindex;             /* Network interface index for map assignment */
    __s32 value_type_btf_obj_fd;   /* File descriptor for the BTF object corresponding to the value type */
    __u32 token_fd;                /* BPF token FD passed in a corresponding command's token_fd field */
    size_t :0;                      /* Reserved for future compatibility (bitfield) */
};
sz: Size of the structure, ensuring forward/backward compatibility.btf_fd, btf_key_type_id, btf_value_type_id, and btf_vmlinux_value_type_id: These fields are related to the BPF Type Format (BTF), which provides type information for the map’s key and value typesinner_map_fd: The file descriptor of an inner map if the map is being used as part of a nested structure.map_flags: Flags that modify the behavior of the map, such as setting the map to read-only or enabling special features (e.g., memory-mapping).map_extra: Reserved for future extensions to the structure or additional configuration.numa_node: Specifies the NUMA node for memory locality when creating the map (used for NUMA-aware systems).map_ifindex: Specifies the network interface index for associating the map with a specific network interface.value_type_btf_obj_fd: A file descriptor pointing to the BTF object representing the map’s value type.token_fd: A token FD for passing file descriptors across different BPF operations.These fields allow for fine-grained control over how the eBPF map behaves, including its memory allocation, access permissions, and type information. Don’t worry about these details now, as some of them will be used shortly when we dive into more examples.
Now that we’ve covered the basics of map creation, let’s start exploring some of the most commonly used eBPF map types.
SEC(".maps")) so that the eBPF program can use it. The “Hash Map User-Space Example snippet”, on the other hand, shows how user-space code (using libbpf and BPF syscalls) can interact with the map—such as creating or obtaining a file descriptor for the map.
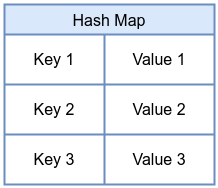
A hash map stores key-value pairs. Each key maps to a corresponding value, and both the key and value have fixed sizes determined at creation time. The hash map provides fast lookups and updates, making it a great choice for data that changes frequently. Common uses include tracking connection states in networking, counting events keyed by process ID or file descriptor, or caching metadata for quick lookups.
BTF Map Definition in eBPF Program
struct {
    __uint(type, BPF_MAP_TYPE_HASH);
    __type(key, int);
    __type(value, int);
    __uint(max_entries, 1024);
} hash_map_example SEC(".maps");
Hash Map User-Space Example
#include <bpf/libbpf.h>
#include <bpf/bpf.h>
#include <errno.h>
#include <unistd.h>

int create_hash_map(void) {
    int fd = bpf_map_create(BPF_MAP_TYPE_HASH, "hash_map_example",
                            sizeof(int),      // key_size
                            sizeof(int),     // value_size
                            1024,             // max_entries
                            NULL);               // map_flags
    if (fd < 0) {
        fprintf(stderr, "Failed to create hash map: %s\n", strerror(errno));
    }
    return fd;
}

int main() {
    int fd = create_hash_map();
    if (fd >= 0) {
        printf("Hash map created successfully with fd: %d\n", fd);
        close(fd);
    }
    return 0;
}
We can compile it using gcc -o hash_map hash_map.c -lbpf and -lbpf which tells the compiler to link against the libbpf library, or by using clang -o ring_buff ring_buff.c -lbpf
close() when you’re done using a BPF map file descriptor to ensure proper resource management, prevent resource leaks, and allow the system to release the map’s resources.
CAP_BPF.
To run this program, you need to use the sudo commandsudo ./hash_map
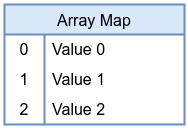
An array map stores a fixed number of elements indexed by integer keys. Unlike a hash map, array keys are not arbitrary—they are simply indexes from 0 to max_entries -1. This simplifies lookups and can provide stable, predictable memory usage. Array maps are perfect for scenarios where you know the exact number of elements you need and require constant-time indexed access. Typical uses include lookup tables, static configuration data, or indexing CPU-related counters by CPU number.
BTF Map Definition in eBPF Program
struct {
    __uint(type, BPF_MAP_TYPE_ARRAY);
    __type(key, int);
    __type(value, int);
    __uint(max_entries, 256);
} array_map_example SEC(".maps");
Array Map User-Space Example
#include <bpf/libbpf.h>
#include <bpf/bpf.h>
#include <errno.h>
#include <unistd.h>

int create_array_map(void) {
    int fd = bpf_map_create(BPF_MAP_TYPE_ARRAY, "array_map_example",
                            sizeof(int),   // key_size
                            sizeof(int),  // value_size
                            256,           // max_entries
                            NULL);            // map_flags
    if (fd < 0) {
        fprintf(stderr, "Failed to create array map: %s\n", strerror(errno));
    }
    return fd;
}

int main() {
    int fd = create_array_map();
    if (fd >= 0) {
        printf("Array map created successfully with fd: %d\n", fd);
        close(fd);
    }
    return 0;
}
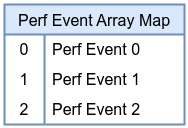
The Perf Event Array map provides a mechanism to redirect perf events (such as hardware counters or software events) into user space using the perf ring buffer infrastructure. By attaching eBPF programs to perf events and using this map, you can efficiently gather performance metrics from the kernel, making it a cornerstone of low-overhead performance monitoring and observability tools.
BTF Map Definition in eBPF Program
struct {
    __uint(type, BPF_MAP_TYPE_PERF_EVENT_ARRAY);
    __type(key, int);
    __type(value, int);
    __uint(max_entries, 64);
} perf_event_array_example SEC(".maps");
max_entries as it will be set automatically to the number of CPUs on your computer by libbpf as per https://nakryiko.com/posts/bpf-ringbuf/.
Pert Event Array Map User-Space Example
#include <bpf/libbpf.h>
#include <bpf/bpf.h>
#include <errno.h>
#include <unistd.h>

int create_perf_event_array_map(void) {
    int fd = bpf_map_create(BPF_MAP_TYPE_PERF_EVENT_ARRAY, "perf_event_array_example",
                            sizeof(int),   // key_size
                            sizeof(int),   // value_size (fd)
                            64,            // max_entries (for events)
                            NULL);            // map_flags
    if (fd < 0) {
        fprintf(stderr, "Failed to create perf event array map: %s\n", strerror(errno));
    }
    return fd;
}

int main() {
    int fd = create_perf_event_array_map();
    if (fd >= 0) {
        printf("perf event array map created successfully with fd: %d\n", fd);
        close(fd);
    }
    return 0;
}
A program array holds references to other eBPF programs, enabling tail calls. Tail calls allow one eBPF program to jump into another without returning, effectively chaining multiple programs into a pipeline. This map type is essential for building modular and dynamic eBPF toolchains that can be reconfigured at runtime without reloading the entire set of programs.
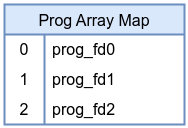
BTF Map Definition in eBPF Program
struct {
    __uint(type, BPF_MAP_TYPE_PROG_ARRAY);
    __type(key, int);
    __type(value, int);
    __uint(max_entries, 32);
} prog_array_example SEC(".maps");
Prog Array Map User-Space Example
#include <bpf/libbpf.h>
#include <bpf/bpf.h>
#include <errno.h>
#include <unistd.h>

int create_prog_array_map(void) {
    int fd = bpf_map_create(BPF_MAP_TYPE_PROG_ARRAY, "prog_array_example",
                            sizeof(int), // key_size
                            sizeof(int), // value_size (prog FD)
                            32,          // max_entries
                            NULL);
    if (fd < 0) {
        fprintf(stderr, "Failed to create prog array map: %s\n", strerror(errno));
    }
    return fd;
}

int main() {
    int fd = create_prog_array_map();
    if (fd >= 0) {
        printf("Prog array map created successfully with fd: %d\n", fd);
        close(fd);
    }
    return 0;
}
A per-CPU hash map is similar to a standard hash map but stores distinct values for each CPU. This design minimizes lock contention and cache-line ping-ponging, allowing for extremely high-performance counting or state tracking when updates are frequent. Each CPU updates its own version of the value, and user space can aggregate these values later.
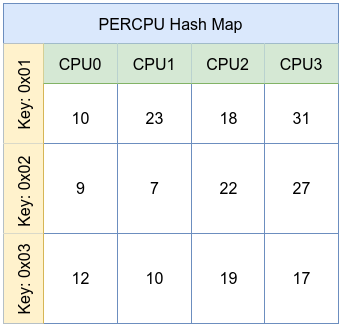
BTF Map Definition in eBPF Program
struct {
    __uint(type, BPF_MAP_TYPE_PERCPU_HASH);
    __type(key, int);
    __type(value, int);
    __uint(max_entries, 1024);
} percpu_hash_example SEC(".maps");
PERCPU Hash Map User-Space Example
#include <bpf/libbpf.h>
#include <bpf/bpf.h>
#include <errno.h>
#include <unistd.h>

int create_percpu_hash_map(void) {
    int fd = bpf_map_create(BPF_MAP_TYPE_PERCPU_HASH, "percpu_hash_example",
                            sizeof(int),    // key_size
                            sizeof(int),   // value_size
                            1024,           // max_entries
                            NULL);
    if (fd < 0) {
        fprintf(stderr, "Failed to create PERCPU hash map: %s\n", strerror(errno));
    }
    return fd;
}

int main() {
    int fd = create_percpu_hash_map();
    if (fd >= 0) {
        printf("PERCPU hash map created successfully with fd: %d\n", fd);
        close(fd);
    }
    return 0;
}
A per-CPU array, like the per-CPU hash, stores distinct copies of array elements for each CPU. This further reduces contention, making it ideal for per-CPU statistics counters, histograms, or other metrics that need to be incremented frequently without facing synchronization overhead.
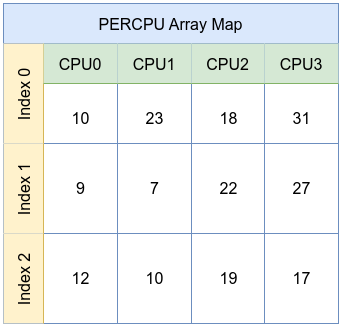
BTF Map Definition in eBPF Program
struct {
    __uint(type, BPF_MAP_TYPE_PERCPU_ARRAY);
    __type(key, int);
    __type(value, int);
    __uint(max_entries, 1024);
} percpu_array_example SEC(".maps");
PERCPU Array Map User-Space Example
#include <bpf/libbpf.h>
#include <bpf/bpf.h>
#include <errno.h>
#include <unistd.h>

int create_percpu_array_map(void) {
    int fd = bpf_map_create(BPF_MAP_TYPE_PERCPU_ARRAY, "percpu_array_example",
                            sizeof(int),    // key_size
                            sizeof(int),   // value_size
                            128,            // max_entries
                            NULL);
    if (fd < 0) {
        fprintf(stderr, "Failed to create PERCPU array map: %s\n", strerror(errno));
    }
    return fd;
}

int main() {
    int fd = create_percpu_array_map();
    if (fd >= 0) {
        printf("PERCPU array map created successfully with fd: %d\n", fd);
        close(fd);
    }
    return 0;
}
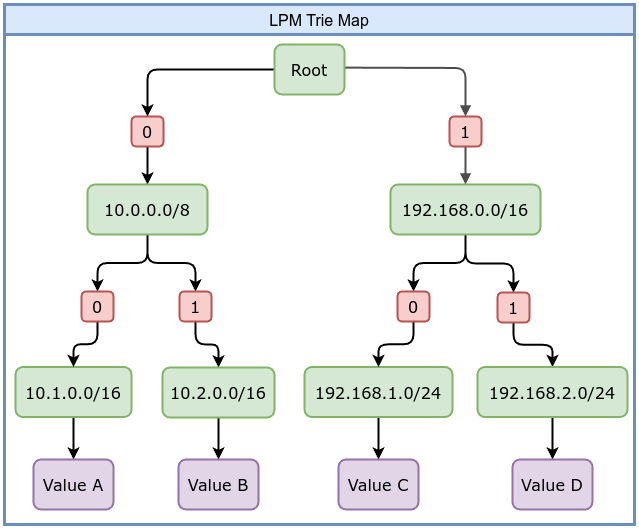
The LPM (Longest Prefix Match) Trie map is designed for prefix-based lookups, commonly used in networking. For example, you might store IP prefixes (like CIDR blocks) and quickly determine which prefix best matches a given IP address. This is useful for routing, firewall rules, or policy decisions based on IP addresses.
BPF_F_NO_PREALLOC flag. This flag prevents the kernel from pre-allocating memory for all entries at map creation time, allowing the map to dynamically allocate memory as needed.
For example, if you create a map that is intended to hold 1,000 entries, the kernel might allocate memory for all 1,000 entries at map creation time. However, in the case of an LPM Trie map, the situation is different. An LPM Trie map is used for prefix-based lookups, such as storing CIDR blocks or IP address prefixes for example 192.168.0.0/24. The number of entries and the amount of memory required for the map can vary depending on the data stored. You can still specify a max_entries value when creating an LPM Trie map, but it is important to note that the kernel will ignore this value. The actual number of entries in an LPM Trie map depends on how many prefixes are inserted, and the map dynamically allocates memory based on the prefixes.
BTF Map Definition in eBPF Program
struct {
    __uint(type, BPF_MAP_TYPE_LPM_TRIE);
    __type(key, int);
    __type(value, int);
    __uint(max_entries, 1024);
} lpm_trie_example SEC(".maps");
LPM Trie Map User-Space Example
#include <bpf/libbpf.h>
#include <bpf/bpf.h>
#include <errno.h>
#include <unistd.h>

int create_lpm_trie_map(void) {

    struct bpf_map_create_opts opts = {0};
    opts.sz = sizeof(opts);
    opts.map_flags = BPF_F_NO_PREALLOC;

    int fd = bpf_map_create(BPF_MAP_TYPE_LPM_TRIE, "lpm_trie_example",
                            8,     // key_size
                            sizeof(long), // value_size
                            1024,  // max_entries and it will ignored
                            &opts);
    if (fd < 0) {
        fprintf(stderr, "Failed to create LMP trie map: %s\n", strerror(errno));
    }
    return fd;
}

int main() {
    int fd = create_lpm_trie_map();
    if (fd >= 0) {
        printf("LMP trie map created successfully with fd: %d\n", fd);
        close(fd);
    }
    return 0;
}
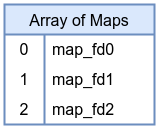
An array-of-maps stores references to other maps. Each element in this array is itself a map FD. This structure allows building hierarchical or modular configurations. For example, you might keep a set of hash maps, each representing a different tenant or set of rules, and select which one to use at runtime by indexing into the array-of-maps. In the following example, we will first create a hash map to serve as the inner map, and then use this hash map as the reference for creating an array of maps.
BTF Map Definition in eBPF Program
struct inner_map {
    __uint(type, BPF_MAP_TYPE_HASH);
    __type(key, int);
    __type(value, int);
    __uint(max_entries, 1024);
} hash_map_example SEC(".maps");

struct {
    __uint(type, BPF_MAP_TYPE_ARRAY_OF_MAPS);
    __type(key, int);
    __type(value, int);
    __uint(max_entries, 4);
    __array(values, struct {
        __uint(type, BPF_MAP_TYPE_HASH);
        __type(key, int);
        __type(value, int);
        __uint(max_entries, 1024);
    });
} array_of_maps_map_example SEC(".maps");
Array of Maps Map User-Space Example
#include <bpf/libbpf.h>
#include <bpf/bpf.h>
#include <errno.h>
#include <unistd.h>

int create_inner_hash_map(void) {
    int fd = bpf_map_create(BPF_MAP_TYPE_HASH, "hash_map_example",
                            sizeof(int),      // key_size
                            sizeof(int),     // value_size
                            1024,             // max_entries
                            NULL);               // map_flags
    if (fd < 0) {
        fprintf(stderr, "Failed to create hash map: %s\n", strerror(errno));
    }
    return fd;
}

int create_array_of_maps(int inner_map_fd) {
    struct bpf_map_create_opts opts = {0};
    opts.sz = sizeof(opts);
    opts.inner_map_fd = inner_map_fd;  // Specify the inner map FD

    int fd = bpf_map_create(BPF_MAP_TYPE_ARRAY_OF_MAPS, "array_of_maps_map_example",
                            sizeof(int),  // key_size
                            sizeof(int),  // value_size (placeholder for map FD)
                            4,            // max_entries
                            &opts);
    if (fd < 0) {
        fprintf(stderr, "Failed to create Array of maps map: %s\n", strerror(errno));
    }
    return fd;
}

int main() {
	// Step 1: Create the inner hash map
    int inner_map_fd = create_inner_hash_map();
    if (inner_map_fd >= 0) {
        printf("Hash map created successfully with fd: %d\n", inner_map_fd);
        close(inner_map_fd);
    }

    // Step 2: Create the array of maps, using the inner map FD
    int array_of_maps_fd = create_array_of_maps(inner_map_fd);
    if (array_of_maps_fd >= 0) {
        printf("Array of maps map created successfully with fd: %d\n", array_of_maps_fd);
        close(array_of_maps_fd);
    }

    if (inner_map_fd >= 0) {
        close(inner_map_fd);
    }
    if (array_of_maps_fd >= 0) {
        close(array_of_maps_fd);
    }
    return 0;
}
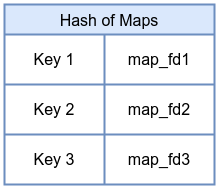
A hash-of-maps extends the concept of array-of-maps to dynamic keying. Instead of indexing by integer, you can use arbitrary keys to select which map is referenced. This allows flexible and dynamic grouping of maps, where user space can manage complex configurations by updating keys and associated map FDs. Again, bpf_create_map() cannot set inner_map_fd, so this example is minimal.
BTF Map Definition in eBPF Program
struct inner_map {
    __uint(type, BPF_MAP_TYPE_HASH);
    __type(key, int);
    __type(value, int);
    __uint(max_entries, 1024);
} hash_map_example SEC(".maps");

struct {
    __uint(type, BPF_MAP_TYPE_HASH_OF_MAPS);
    __type(key, int);
    __type(value, int);
    __uint(max_entries, 4);
    __array(values, struct {
        __uint(type, BPF_MAP_TYPE_HASH);
        __type(key, int);
        __type(value, int);
        __uint(max_entries, 1024);
    });
} hash_of_maps_map_example SEC(".maps");
Hash of Maps Map User-Space Example
#include <bpf/libbpf.h>
#include <bpf/bpf.h>
#include <errno.h>
#include <unistd.h>

int create_inner_hash_map(void) {
    int fd = bpf_map_create(BPF_MAP_TYPE_HASH, "hash_map_example",
                            sizeof(int),      // key_size
                            sizeof(int),     // value_size
                            1024,             // max_entries
                            NULL);               // map_flags
    if (fd < 0) {
        fprintf(stderr, "Failed to create hash map: %s\n", strerror(errno));
    }
    return fd;
}

int create_hash_of_maps(int inner_map_fd) {
    struct bpf_map_create_opts opts = {0};
    opts.sz = sizeof(opts);
    opts.inner_map_fd = inner_map_fd;  // Specify the inner map FD

    int fd = bpf_map_create(BPF_MAP_TYPE_HASH_OF_MAPS, "hash_of_maps_map_example",
                            sizeof(int),  // key_size
                            sizeof(int),  // value_size (placeholder for map FD)
                            4,            // max_entries
                            &opts);
    if (fd < 0) {
        fprintf(stderr, "Failed to create hash of maps map: %s\n", strerror(errno));
    }
    return fd;
}

int main() {
	// Step 1: Create the inner hash map
    int inner_map_fd = create_inner_hash_map();
    if (inner_map_fd >= 0) {
        printf("Hash map created successfully with fd: %d\n", inner_map_fd);
    }

    // Step 2: Create the array of maps, using the inner map FD
    int array_of_maps_fd = create_hash_of_maps(inner_map_fd);
    if (array_of_maps_fd >= 0) {
        printf("Array_of_maps map created successfully with fd: %d\n", array_of_maps_fd);
    }

    if (inner_map_fd >= 0) {
        close(inner_map_fd);
    }
    if (array_of_maps_fd >= 0) {
        close(array_of_maps_fd);
    }
    return 0;
}
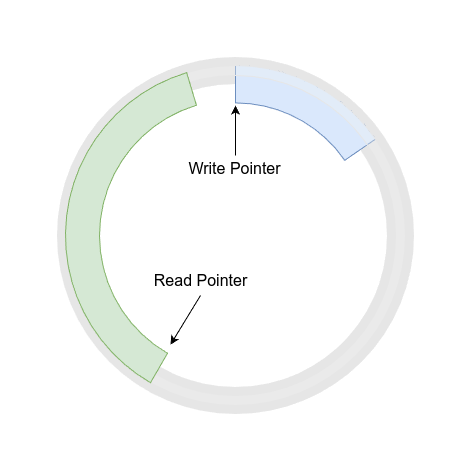
The ring buffer map is a relatively new addition that enables lock-free communication from kernel to user space. Instead of performing lookups or updates for each record, the kernel-side eBPF program writes events into the ring buffer, and user space reads them as a continuous stream. A ring buffer is a circular data structure that uses a continuous block of memory to store data sequentially. When data is added to the buffer and the end is reached, new data wraps around to the beginning, potentially overwriting older data if it hasn’t been read yet.
A typical ring buffer uses two pointers (or “heads”): one for writing and one for reading. The write pointer marks where new data is added, while the read pointer indicates where data should be consumed. This dual-pointer system allows for efficient and concurrent operations, ensuring that the writer doesn’t overwrite data before the reader has processed it. Additionally, the ring buffer is shared across all CPUs, consolidating events from multiple cores into a single stream. This greatly reduces overhead for high-volume event reporting, making it ideal for profiling, tracing, or continuous monitoring tools.
BTF Map Definition in eBPF Program
struct {
    __uint(type, BPF_MAP_TYPE_RINGBUF);
    __uint(max_entries, 4096); //It must be a power of 2
} ring_buffer_map_example SEC(".maps");
max_entries in BPF_MAP_TYPE_RINGBUF must be a power of 2 such as 4096.
Ring Buffer Map User-Space Example
#include <bpf/libbpf.h>
#include <bpf/bpf.h>
#include <errno.h>
#include <unistd.h>

int create_ringbuf_map(void) {
    // The size of the ringbuf is given in bytes by max_entries.
    int fd = bpf_map_create(BPF_MAP_TYPE_RINGBUF, "ring_buffer_map_example",
                            0,    // key_size = 0 for ringbuf
                            0,    // value_size = 0 for ringbuf
                            4096,
                            NULL);
    if (fd < 0) {
        fprintf(stderr, "Failed to create ring buffer map: %s\n", strerror(errno));
    }
    return fd;
}

int main() {
    int fd = create_ringbuf_map();
    if (fd >= 0) {
        printf("Ring buffer map created successfully with fd: %d\n", fd);
        close(fd);
    }
    return 0;
}
By combining these map types with your eBPF programs, you can build sophisticated, runtime-configurable kernel instrumentation, security monitors, network traffic analyzers, and performance profiling tools. Each map type adds a new capability or performance characteristic, allowing developers to craft solutions that were previously challenging or impossible without kernel modifications. This flexibility not only enhances existing solutions but also opens up new possibilities for kernel-level programming. Given the ongoing evolution of eBPF, selecting the right map type for your use case becomes even more important. When doing so, it’s essential to consider factors such as access patterns, data size, performance requirements, and the complexity of your architecture. Here are some things to keep in mind:
BPF_MAP_TYPE_ARRAY. If keys are dynamic or unpredictable, BPF_MAP_TYPE_HASH might be the go-to.BPF_MAP_TYPE_PERCPU_HASH or BPF_MAP_TYPE_PERCPU_ARRAY) can reduce contention. Similarly, BPF_MAP_TYPE_RINGBUF is the perfect fit for high-throughput streaming scenarios.BPF_MAP_TYPE_PROG_ARRAY, BPF_MAP_TYPE_ARRAY_OF_MAPS, or BPF_MAP_TYPE_HASH_OF_MAPS to facilitate more sophisticated architectures.BPF_MAP_TYPE_LPM_TRIE offers a specialized structure optimized for network prefixes and routing logic.BPF_MAP_TYPE_PERF_EVENT_ARRAY ties into the Linux perf subsystem, enabling advanced performance monitoring and event correlation in conjunction with eBPF programs.eBPF map operations are a set of functions defined in the Linux kernel that allow interaction with eBPF maps. These operations enable reading, writing, deleting, and managing data within the maps. The operations are part of the bpf_cmd defined in the kernel source file /include/uapi/linux/bpf.h. Some commonly used operations include:
BPF_MAP_CREATE: Creates a new eBPF map. This operation sets up a map.BPF_MAP_UPDATE_ELEM: Inserts or updates a key-value pair.BPF_MAP_LOOKUP_ELEM: Retrieves the value associated with a given key.BPF_MAP_DELETE_ELEM: Deletes a key-value pair by its key.BPF_MAP_LOOKUP_AND_DELETE_ELEM: Retrieves a value by key and deletes the entry in one step.BPF_MAP_GET_NEXT_KEY: Iterates through the keys in the map.BPF_MAP_LOOKUP_BATCH: Retrieves multiple entries in a single call.BPF_MAP_UPDATE_BATCH: Updates multiple entries at once.BPF_MAP_DELETE_BATCH: Deletes multiple entries in one operation.BPF_MAP_FREEZE: Converts the map into a read-only state.BPF_OBJ_PIN: Pins the map to the BPF filesystem so it persists beyond the process’s lifetime.BPF_OBJ_GET: Retrieves a previously pinned map.These operations allow efficient data sharing between eBPF programs and user-space applications. The bpf() syscall is used to perform these operations, providing a flexible interface for interacting with eBPF maps. Each operation serves a specific purpose.
In this chapter, we have already explained BPF_MAP_CREATE in detail , so we will not cover it again. Instead, we will focus on the rest. We will show how to use them with a simple hash map and explain the code thoroughly.
Some map operations differ between user-space and kernel-space code. In user-space, you interact with eBPF maps using file descriptors and functions that often require an output parameter, Libbpf provides convenient wrappers for these commands which are defined in tools/lib/bpf/bpf.c.
int bpf_map_update_elem(int fd, const void *key, const void *value,
			__u64 flags)
{
	const size_t attr_sz = offsetofend(union bpf_attr, flags);
	union bpf_attr attr;
	int ret;

	memset(&attr, 0, attr_sz);
	attr.map_fd = fd;
	attr.key = ptr_to_u64(key);
	attr.value = ptr_to_u64(value);
	attr.flags = flags;

	ret = sys_bpf(BPF_MAP_UPDATE_ELEM, &attr, attr_sz);
	return libbpf_err_errno(ret);
}

int bpf_map_lookup_elem(int fd, const void *key, void *value)
{
	const size_t attr_sz = offsetofend(union bpf_attr, flags);
	union bpf_attr attr;
	int ret;

	memset(&attr, 0, attr_sz);
	attr.map_fd = fd;
	attr.key = ptr_to_u64(key);
	attr.value = ptr_to_u64(value);

	ret = sys_bpf(BPF_MAP_LOOKUP_ELEM, &attr, attr_sz);
	return libbpf_err_errno(ret);
}
[...]
whereas in kernel-space (within eBPF programs) perform equivalent operations using built-in helper functions which are defined in kernel/bpf/helpers.c.
BPF_CALL_2(bpf_map_lookup_elem, struct bpf_map *, map, void *, key)
{
	WARN_ON_ONCE(!rcu_read_lock_held() && !rcu_read_lock_trace_held() &&
		     !rcu_read_lock_bh_held());
	return (unsigned long) map->ops->map_lookup_elem(map, key);
}

const struct bpf_func_proto bpf_map_lookup_elem_proto = {
	.func		= bpf_map_lookup_elem,
	.gpl_only	= false,
	.pkt_access	= true,
	.ret_type	= RET_PTR_TO_MAP_VALUE_OR_NULL,
	.arg1_type	= ARG_CONST_MAP_PTR,
	.arg2_type	= ARG_PTR_TO_MAP_KEY,
};

BPF_CALL_4(bpf_map_update_elem, struct bpf_map *, map, void *, key,
	   void *, value, u64, flags)
{
	WARN_ON_ONCE(!rcu_read_lock_held() && !rcu_read_lock_trace_held() &&
		     !rcu_read_lock_bh_held());
	return map->ops->map_update_elem(map, key, value, flags);
}
Additionally, some operations—like batch operations and object pinning/getting—are implemented in the kernel but are intended to be invoked from user-space via system calls or libbpf rather than being used directly inside eBPF programs. We’ll explain each operation in both contexts.
BPF_MAP_UPDATE_ELEM command inserts or updates a key-value pair in the map.
The function bpf_map_update_elem is a libbpf wrapper for BPF_MAP_UPDATE_ELEM command, it’s part of the libbpf library, which provides a user-space interface for interacting with eBPF maps in the Linux kernel with prototype as follows:
int bpf_map_update_elem(int fd, const void *key, const void *value, __u64 flags);
It takes a map file descriptor, pointers to the key and value, and a flag indicating how the update should be performed. The flag can be
BPF_NOEXIST to insert only if the key does not exist.BPF_EXIST to update only if the key already exists.BPF_ANY to insert or update unconditionally.
On success, this call returns zero. On failure, it returns -1 and sets errno to indicate the cause of the error. For instance, if you use BPF_NOEXIST but the key already exists, it returns EEXIST. If you use BPF_EXIST but the key does not exist, it returns ENOENT which is No such file or directory.BPF_NOEXIST isn’t supported for array type maps since all keys always exist.
Here is an example that first tries to insert a new element using BPF_NOEXIST and then updates it using BPF_EXIST:
#include <bpf/libbpf.h>
#include <bpf/bpf.h>
#include <errno.h>
#include <unistd.h>

int create_hash_map(void) {
    int fd = bpf_map_create(BPF_MAP_TYPE_HASH, "hash_map_example",
                            sizeof(int),      // key_size
                            sizeof(int),     // value_size
                            1024,             // max_entries
                            NULL);            // map_flags
    if (fd < 0) {
        fprintf(stderr, "Failed to create hash map: %s\n", strerror(errno));
    }
    return fd;
}

int main() {
    int fd = create_hash_map();
    if (fd >= 0) {
        printf("Hash map created successfully with fd: %d\n", fd);

        // Insert elements in the hash map
        int key = 5;
        long value = 100;
        if (bpf_map_update_elem(fd, &key, &value, BPF_ANY) == 0) {  // BPF_ANY means insert or update
            printf("Element inserted or updated successfully: key = %d, value = %ld\n", key, value);
        } else {
            fprintf(stderr, "Failed to insert or update element: %s\n", strerror(errno));
            close(fd);  // Close the map before returning
            return -1;
        }

        // Update an element in the hash map
        value = 200;
        if (bpf_map_update_elem(fd, &key, &value, BPF_EXIST) == 0) {
            printf("Element inserted or updated successfully: key = %d, value = %ld\n", key, value);
        } else {
            fprintf(stderr, "Failed to insert or update element: %s\n", strerror(errno));
            close(fd);  // Close the map before returning
            return -1;
        }

        // Update an element that doesn't exist in the hash map
        key = 4;
        value = 300;
        if (bpf_map_update_elem(fd, &key, &value, BPF_EXIST) == 0) {
            printf("Element inserted or updated successfully: key = %d, value = %ld\n", key, value);
        } else {
            fprintf(stderr, "Failed to insert or update element: %s\n", strerror(errno));
            close(fd);  // Close the map before returning
            return -1;
        }
        close(fd);
        return 0;
    }
    return -1;
}
To compile and run the program, use the following command: gcc -o update-ebpf-map update-ebpf-map.c -lbpf.
Then, execute the program with: sudo ./update-ebpf-map.
We first create a map and then insert (5 -> 100) using BPF_ANY, which either inserts or updates unconditionally. Since the map was empty, (5 -> 100) is inserted. Next, we update (5 -> 100) to (5 -> 200) using BPF_EXIST, ensuring that the key must exist beforehand. The operation succeeds, and the value associated with key 5 is now 200.
Then, we try to insert (4 -> 300) using BPF_EXIST, which requires the key to already exist in the map. Since the key 4 does not exist in the map, the operation fails, and the error ENOENT is triggered, resulting in the message “Failed to insert or update element: No such file or directory.”
The output from running the program (sudo ./update-ebpf-map) is as follows:
Hash map created successfully with fd: 3
Element inserted or updated successfully: key = 5, value = 100
Element inserted or updated successfully: key = 5, value = 200
Failed to insert or update element: No such file or directory
int bpf_map_update_elem(void *map, const void *key, const void *value, __u64 flags);
BPF_MAP_LOOKUP_ELEM command is used to retrieve the value associated with a given key. The bpf_map_lookup_elem function is a libbpf wrapper for BPF_MAP_LOOKUP_ELEM command and its prototype is : int bpf_map_lookup_elem(int fd, const void *key, void *value) , so you provide the map’s file descriptor, a pointer to the key you want to look up, and a pointer to a buffer where the value will be stored if the key is found. If the operation succeeds, it returns zero, and the value is copied into the user-provided buffer. If the key does not exist, it returns -1 and sets errno to ENOENT.
Consider a scenario where you have inserted an entry (key=10, value=100) into the map. Looking it up would look like this:
#include <bpf/libbpf.h>
#include <bpf/bpf.h>
#include <errno.h>
#include <unistd.h>

int create_hash_map(void) {
    int fd = bpf_map_create(BPF_MAP_TYPE_HASH, "hash_map_example",
                            sizeof(int),      // key_size
                            sizeof(int),     // value_size
                            1024,             // max_entries
                            NULL);            // map_flags
    if (fd < 0) {
        fprintf(stderr, "Failed to create hash map: %s\n", strerror(errno));
    }
    return fd;
}

int main() {
    int fd = create_hash_map();
    if (fd >= 0) {
        printf("Hash map created successfully with fd: %d\n", fd);

        // Insert a single entry: (10 -> 100)
        int key = 10;
        int value = 100;
        if (bpf_map_update_elem(fd, &key, &value, BPF_ANY) == 0) {
            printf("Element inserted or updated successfully: key = %d, value = %ld\n", key, value);
        } else {
            fprintf(stderr, "Failed to insert or update element: %s\n", strerror(errno));
            close(fd);
            return -1;
        }

        // Attempt to look up the value for key=10
        int lookup_key = 10;
        int lookup_val = 0;
        if (bpf_map_lookup_elem(fd, &lookup_key, &lookup_val) == 0) {
            printf("Found value %d for key %d\n", lookup_val, lookup_key);
        } else {
            fprintf(stderr, "Element doesn't exist: %s\n", strerror(errno));
            close(fd);
            return -1;
        }

        // Attempt to look up a value that doesn't exist
        lookup_key = 11;
        lookup_val = 0;
        if (bpf_map_lookup_elem(fd, &lookup_key, &lookup_val) == 0) {
            printf("Found value %d for key %d\n", lookup_val, lookup_key);
        } else {
            fprintf(stderr, "Element doesn't exist: %s\n", strerror(errno));
            close(fd);
            return -1;
        }
        close(fd);
        return 0;
    }
    return -1;
}
In this example, we first create a hash map, then insert (10 -> 100) into it. When we call bpf_map_lookup_elem with lookup_key=10, the kernel checks the map for this key. Since it exists, lookup_val is set to 100 and the function returns zero. If the key had not existed, bpf_map_lookup_elem would return -1 and set errno=ENOENT and the output should look like:
Hash map created successfully with fd: 3
Element inserted or updated successfully: key = 10, value = 100
Found value 100 for key 10
Element doesn't exist: No such file or directory
This operation allows you to query the map and read the data it contains without modifying it. If the map is empty or does not contain the requested key, bpf_map_lookup_elem simply fails and sets an appropriate error code.
void *bpf_map_lookup_elem(const void *map, const void *key);
BPF_MAP_DELETE_ELEM command removes a key-value pair from the map.
The bpf_map_delete_elem function is a libbpf wrapper for BPF_MAP_DELETE_ELEM command and its prototype is : int bpf_map_delete_elem(int fd, const void *key) which takes a map file descriptor and a pointer to the key you want to remove. If the key is found and deleted, it returns zero. If the key does not exist, it returns -1 and sets errno=ENOENT.
Here is an example of deleting a key:
#include <bpf/libbpf.h>
#include <bpf/bpf.h>
#include <errno.h>
#include <unistd.h>

int create_hash_map(void) {
    int fd = bpf_map_create(BPF_MAP_TYPE_HASH, "hash_map_example",
                            sizeof(int),      // key_size
                            sizeof(int),     // value_size
                            1024,             // max_entries
                            NULL);            // map_flags
    if (fd < 0) {
        fprintf(stderr, "Failed to create hash map: %s\n", strerror(errno));
    }
    return fd;
}

int main() {
    int fd = create_hash_map();
    if (fd >= 0) {
        printf("Hash map created successfully with fd: %d\n", fd);

        // Insert a key-value pair (20 -> 250)
        int key = 20;
        int value = 250;
        if (bpf_map_update_elem(fd, &key, &value, BPF_ANY) == 0) {
            printf("Element inserted or updated successfully: key = %d, value = %ld\n", key, value);
        } else {
            fprintf(stderr, "Failed to insert or update element: %s\n", strerror(errno));
            close(fd);
            return -1;
        }

        // Now delete the key-value pair for key=20
        if (bpf_map_delete_elem(fd, &key) == 0) {
            printf("Key %d deleted successfully\n", key);
        } else {
            fprintf(stderr, "Failed to delete element: %s\n", strerror(errno));
            close(fd);
            return 1;
        }

        // Confirm that the key no longer exists
        int lookup_val;
        if (bpf_map_lookup_elem(fd, &key, &lookup_val) == 0) {
            printf("Unexpectedly found key %d after deletion, value=%d\n", key, lookup_val);
        } else {
            if (errno == ENOENT) {
                printf("Confirmed that key %d no longer exists\n", key);
            } else {
                printf("Element still exists\n");
            }
        }
        close(fd);
        return 0;
    }
    return -1;
}
After inserting (20 -> 250) into the map, we call bpf_map_delete_elem to remove it. The call succeeds, returning zero. A subsequent lookup for key=20 fails with ENOENT, confirming that the entry has been removed and the output:
Hash map created successfully with fd: 3
Element inserted or updated successfully: key = 20, value = 250
Key 20 deleted successfully
Confirmed that key 20 no longer exists
If you call bpf_map_delete_elem for a key that does not exist, the operation simply returns an error and sets errno=ENOENT, indicating that there was nothing to delete.
int bpf_map_delete_elem(void *map, const void *key);
BPF_MAP_LOOKUP_AND_DELETE_ELEM command retrieves the value associated with the given key, just like BPF_MAP_LOOKUP_ELEM command, but it also removes the key-value pair from the map in a single operation The bpf_map_lookup_and_delete_elem function is a libbpf wrapper for BPF_MAP_LOOKUP_AND_DELETE_ELEM command and its prototype is: int bpf_map_lookup_and_delete_elem(int fd, const void *key, void *value) . If the key exists, the function returns zero, copies the value to the user-provided buffer, and deletes that entry from the map. If the key is not found, it returns -1 and sets errno=ENOENT. This operation is particularly useful for scenarios where you want to consume entries from a map, such as implementing a queue or stack-like structure, or simply ensuring that once you retrieve a value, it is removed without requiring a separate delete call.
First, consider inserting a key-value pair and then looking it up and deleting it at the same time:
#include <bpf/libbpf.h>
#include <bpf/bpf.h>
#include <errno.h>
#include <unistd.h>

int create_hash_map(void) {
    int fd = bpf_map_create(BPF_MAP_TYPE_HASH, "hash_map_example",
                            sizeof(int),      // key_size
                            sizeof(int),     // value_size
                            1024,             // max_entries
                            NULL);            // map_flags
    if (fd < 0) {
        fprintf(stderr, "Failed to create hash map: %s\n", strerror(errno));
    }
    return fd;
}

int main() {
    int fd = create_hash_map();
    if (fd >= 0) {
        printf("Hash map created successfully with fd: %d\n", fd);

        // Insert a key-value pair (10 -> 100)
        int key = 10;
        int value = 100;
        if (bpf_map_update_elem(fd, &key, &value, BPF_ANY) == 0) {
            printf("Element inserted or updated successfully: key = %d, value = %ld\n", key, value);
        } else {
            fprintf(stderr, "Failed to insert or update element: %s\n", strerror(errno));
            close(fd);
            return -1;
        }

        // Now perform lookup-and-delete
        int lookup_val;
        if (bpf_map_lookup_and_delete_elem(fd, &key, &lookup_val) == 0) {
            printf("Lookup and delete succeeded, value=%d\n", lookup_val);
        } else {
            fprintf(stderr, "Failed to insert or update element: %s\n", strerror(errno));
            close(fd);
            return 1;
        }

        // Verify that the key is no longer in the map
        int verify_val;
        if (bpf_map_lookup_elem(fd, &key, &verify_val) == 0) {
            printf("Unexpectedly found key %d after deletion\n", key);
        } else if (errno == ENOENT) {
            printf("Confirmed that key %d no longer exists\n", key);
        } else {
            printf("Element still exists\n");
        }
        close(fd);
        return 0;
    }
    return -1;
}
The previous example inserts (10 -> 100) into a hash map, then the program calls bpf_map_lookup_and_delete_elem for key=10. The operation returns the value 100 and removes the entry from the map at the same time. A subsequent lookup confirms the key is gone. The output is similar to this:
Hash map created successfully with fd: 3
Element inserted or updated successfully: key = 10, value = 100
Lookup and delete succeeded, value=100
Confirmed that key 10 no longer exists
void *bpf_map_lookup_and_delete_elem(const void *map, const void *key);
BPF_MAP_GET_NEXT_KEY command iterates through the keys in a map. If you pass a specific key, the function returns the next key in the map, or sets errno=ENOENT if there is no next key. If you call it with a non-existing key or a NULL pointer (in some usages), it can return the first key in the map. This allows you to iterate over all keys one by one, even if you do not know them in advance.. The bpf_map_get_next_key function is a libbpf wrapper for BPF_MAP_GET_NEXT_KEY command and its prototype is: int bpf_map_get_next_key(int fd, const void *key, void *next_key).
It’s important to note that the order of keys returned by bpf_map_get_next_key is not guaranteed to be the same as the typical ordering found in most iterators in other programming languages. The keys in eBPF maps are stored in an internal, arbitrary order determined by the kernel. Therefore, the order in which keys are returned when iterating is not necessarily sequential (e.g., ascending or based on insertion order). If you need a specific order, such as sorted keys, you will need to handle that ordering manually in your application.
Here’s how you might iterate over all keys:
#include <bpf/libbpf.h>
#include <bpf/bpf.h>
#include <errno.h>
#include <unistd.h>

int create_hash_map(void) {
    int fd = bpf_map_create(BPF_MAP_TYPE_HASH, "hash_map_example",
                            sizeof(int),      // key_size
                            sizeof(int),     // value_size
                            1024,             // max_entries
                            NULL);            // map_flags
    if (fd < 0) {
        fprintf(stderr, "Failed to create hash map: %s\n", strerror(errno));
    }
    return fd;
}

int main() {
    int fd = create_hash_map();
    if (fd >= 0) {
        printf("Hash map created successfully with fd: %d\n", fd);

        // Insert multiple keys for demonstration
        int keys[] = {10, 20, 30};
        int values[] = {100, 200, 300};
        for (int i = 0; i < 3; i++) {
            if (bpf_map_update_elem(fd, &keys[i], &values[i], BPF_ANY) == 0) {
                printf("Element inserted or updated successfully: key = %d, value = %ld\n", keys[i], values[i]);
            } else {
                fprintf(stderr, "Failed to insert or update element: %s\n", strerror(errno));
                close(fd);
                return -1;
            }
        }

        // We'll start by using a key that doesn't exist (e.g., start_key=-1) to get the first key.
        int start_key = -1;
        int next_key;
        if (bpf_map_get_next_key(fd, &start_key, &next_key) == 0) {
            printf("Next key: %d\n", next_key);
        } else {
            fprintf(stderr, "Error getting next key: %s\n", strerror(errno));
            close(fd);
            return -1;
        }

        // Move to the next key
        start_key = next_key;
        if (bpf_map_get_next_key(fd, &start_key, &next_key) == 0) {
            printf("Next key: %d\n", next_key);
        } else {
            fprintf(stderr, "Error getting next key: %s\n", strerror(errno));
            close(fd);
            return -1;
        }
        close(fd);
        return 0;
    }
    return -1;
}
In this example, we insert (10->100), (20->200), (30->300) into the map. We start iteration with a key (-1) that we know does not exist. The kernel returns the first key in ascending order. We then print each key-value pair and call bpf_map_get_next_key to advance to the next key. When ENOENT is returned, we know we have reached the end of the map. This process allows scanning the map’s contents without knowing the keys upfront.
int bpf_map_get_next_key(const void *map, const void *key, void *next_key);
BPF_MAP_LOOKUP_BATCH command fetches multiple elements from the map in a single call. Instead of calling BPF_MAP_LOOKUP_ELEM command repeatedly for each key, you can use this operation to retrieve several keys and their associated values at once. This improves performance when dealing with large maps or when you need to read multiple entries efficiently.
The bpf_map_lookup_batch function is a libbpf wrapper for BPF_MAP_LOOKUP_BATCH command and it uses two special parameters: in_batch and out_batch, which help maintain the state between successive batch lookups. You begin by passing a NULL in_batch to start from the first set of entries. The kernel then returns a batch of (key, value) pairs and sets out_batch to indicate where to resume from. On subsequent calls, you pass out_batch as in_batch to continue retrieving the next batch of entries until all entries have been retrieved. This method is particularly efficient for maps with a large number of entries, as it reduces the overhead of making individual lookups for each element, thus speeding up the retrieval process.
The helper function prototype is
int bpf_map_lookup_batch(int fd, void *in_batch, void *out_batch, void *keys,
                         void *values, __u32 *count, const struct bpf_map_batch_opts *opts);
NULL for the first call to start from the beginning of the map. On subsequent calls, you pass the address of out_batch to continue from the last retrieved entry.NULL if not needed).Let’s go through an example:
#include <bpf/libbpf.h>
#include <bpf/bpf.h>
#include <errno.h>
#include <unistd.h>

int create_hash_map(void) {
    int fd = bpf_map_create(BPF_MAP_TYPE_HASH, "hash_map_example",
                            sizeof(int),      // key_size
                            sizeof(int),     // value_size
                            1024,             // max_entries
                            NULL);            // map_flags
    if (fd < 0) {
        fprintf(stderr, "Failed to create hash map: %s\n", strerror(errno));
    }
    return fd;
}

int main() {
    int fd = create_hash_map();
    if (fd >= 0) {
        printf("Hash map created successfully with fd: %d\n", fd);

        // Insert several entries for demonstration
        int keys[] = {10, 20, 30, 40, 50, 60, 70, 80, 90};
        int values[] = {100, 200, 300, 400, 500, 600, 700, 800, 900};
        for (int i = 0; i < 9; i++) {
            if (bpf_map_update_elem(fd, &keys[i], &values[i], BPF_ANY) == 0) {
                printf("Element inserted or updated successfully: key = %d, value = %ld\n", keys[i], values[i]);
            } else {
                fprintf(stderr, "Failed to insert or update element: %s\n", strerror(errno));
                close(fd);
                return -1;
            }
        }

        // Prepare to batch lookup
        int batch_keys[1024];
        int batch_vals[1024];
        __u32 batch_count = 2;  // Number of elements to retrieve in one go
        __u32 *in_batch = NULL;  // Start from the beginning
        __u32 out_batch;
        int err;

        do {
            err = bpf_map_lookup_batch(fd, in_batch, &out_batch,
                                       batch_keys, batch_vals, &batch_count, NULL);
            if (err == 0) {
                for (unsigned i = 0; i < batch_count; i++) {
                    printf("Batch element: key=%d, value=%d\n", batch_keys[i], batch_vals[i]);
                }

                // Prepare for next batch: continue from last position
                in_batch = &out_batch;  // Set `in_batch` to the position of the last element
            } else if (errno != ENOENT) {
                // An error other than ENOENT means a failure occurred.
                fprintf(stderr, "Lookup batch failed: %s\n", strerror(errno));
                break;
            }
        } while (err == 0);
        close(fd);
        return 0;
    }
    return -1;
}
The previous example first inserts nine key-value pairs into a hash map. Then, it calls bpf_map_lookup_batch repeatedly to retrieve elements in batches, until ENOENT indicates that all entries have been retrieved. Each successful batch call prints out a subset of the map entries. Since there are only nine entries, you will likely retrieve them in one or two batches, depending on the batch size. However, this method scales well for larger maps.
The batch size is set to 2 (in batch_count), meaning the program will attempt to retrieve two entries in each call to bpf_map_lookup_batch. If the map does not contain enough entries to fill the entire batch, batch_count is adjusted to reflect how many entries were actually returned. When bpf_map_lookup_batch eventually returns ENOENT, it indicates that all elements have been retrieved. The output could be like:
Hash map created successfully with fd: 3
Element inserted or updated successfully: key = 10, value = 100
Element inserted or updated successfully: key = 20, value = 200
Element inserted or updated successfully: key = 30, value = 300
Element inserted or updated successfully: key = 40, value = 400
Element inserted or updated successfully: key = 50, value = 500
Element inserted or updated successfully: key = 60, value = 600
Element inserted or updated successfully: key = 70, value = 700
Element inserted or updated successfully: key = 80, value = 800
Element inserted or updated successfully: key = 90, value = 900
Batch element: key=30, value=300
Batch element: key=20, value=400
Batch element: key=80, value=800
Batch element: key=70, value=900
Batch element: key=60, value=600
Batch element: key=40, value=700
Batch element: key=50, value=500
Batch element: key=90, value=600
There is no helper function for such operation.
BPF_MAP_UPDATE_BATCH command allows you to insert or update multiple keys and values in a single call. Similar to BPF_MAP_LOOKUP_BATCH command, this can significantly reduce overhead compared to performing multiple BPF_MAP_LOOKUP_ELEM calls in a loop. The bpf_map_update_batch function is a libbpf wrapper for BPF_MAP_UPDATE_BATCH command and its prototype is:
int bpf_map_update_batch(int fd, const void *keys, const void *values, __u32 *count,
			 const struct bpf_map_batch_opts *opts)
You provide arrays of keys and values, along with a count, and bpf_map_update_batch attempts to insert or update all of them at once. Just like bpf_map_update_elem, you can specify flags such as BPF_ANY, BPF_NOEXIST, or BPF_EXIST to control insertion and update behavior as we mentioned earlier.
#include <bpf/libbpf.h>
#include <bpf/bpf.h>
#include <errno.h>
#include <unistd.h>

int create_hash_map(void) {
    int fd = bpf_map_create(BPF_MAP_TYPE_HASH, "hash_map_example",
                            sizeof(int),      // key_size
                            sizeof(int),     // value_size
                            1024,             // max_entries
                            NULL);            // map_flags
    if (fd < 0) {
        fprintf(stderr, "Failed to create hash map: %s\n", strerror(errno));
    }
    return fd;
}

int main() {
    int fd = create_hash_map();
    if (fd >= 0) {
        printf("Hash map created successfully with fd: %d\n", fd);

        // Prepare arrays of keys and values
        int bulk_keys[3] = {40, 50, 60};
        int bulk_values[3] = {400, 500, 600};
        __u32 bulk_count = 3;

        // Update multiple entries in one go
        if (bpf_map_update_batch(fd, bulk_keys, bulk_values, &bulk_count, BPF_ANY) == 0) {
            printf("Batch update succeeded\n");
        } else {
            fprintf(stderr, "Batch update failed: %s\n", strerror(errno));
            close(fd);
            return 1;
        }

        // Verify that the entries are now in the map
        for (int i = 0; i < 3; i++) {
            int val;
            if (bpf_map_lookup_elem(fd, &bulk_keys[i], &val) == 0) {
                printf("Key=%d, Value=%d\n", bulk_keys[i], val);
            } else {
                fprintf(stderr, "Key=%d not found after batch update: %s\n", bulk_keys[i], strerror(errno));
            }
        }
        close(fd);
        return 0;
    }
    return -1;
}
This example inserts (40->400), (50->500), and (60->600) into the map in a single bpf_map_update_batch call. Afterward, we verify that all three keys were successfully inserted. If any error occurs (e.g., map is full), some keys might be updated before the error is returned. You can inspect errno and bulk_count for partial success handling.
Hash map created successfully with fd: 3
Batch update succeeded
Key=40, Value=400
Key=50, Value=600
Key=60, Value=50
This bulk approach is especially beneficial when populating maps with a large set of keys during initialization or when updating multiple entries at once.
There is no helper function for such operation.
BPF_MAP_DELETE_BATCH command removes multiple entries from the map in a single call, much like BPF_MAP_DELETE_ELEM does for individual keys. You supply arrays of keys along with a count, and the kernel attempts to delete all those keys at once. This operation is more efficient than deleting entries one by one, especially for large sets of keys. The bpf_map_delete_batch function is a libbpf wrapper for BPF_MAP_DELETE_BATCH command and its prototype is:
int bpf_map_delete_batch(int fd, const void *keys, __u32 *count,
			 const struct bpf_map_batch_opts *opts)
The fd parameter is the file descriptor for the map, and keys is a pointer to an array of keys to delete. The count parameter specifies the number of keys to delete and is updated with the actual number of deletions. The opts parameter is optional and allows additional configuration (usually passed as NULL). The function returns 0 if successful, or a negative error code if an error occurs, with errno providing more details.
For example, if your map currently contains (10->100), (20->200), and (30->300), and you want to remove (10, 20, 30) all at once:
#include <bpf/libbpf.h>
#include <bpf/bpf.h>
#include <errno.h>
#include <unistd.h>

int create_hash_map(void) {
    int fd = bpf_map_create(BPF_MAP_TYPE_HASH, "hash_map_example",
                            sizeof(int),      // key_size
                            sizeof(int),     // value_size
                            1024,             // max_entries
                            NULL);            // map_flags
    if (fd < 0) {
        fprintf(stderr, "Failed to create hash map: %s\n", strerror(errno));
    }
    return fd;
}

int main() {
    int fd = create_hash_map();
    if (fd >= 0) {
        printf("Hash map created successfully with fd: %d\n", fd);

        // Prepare arrays of keys and values
        int bulk_keys[3] = {40, 50, 60};
        int bulk_values[3] = {400, 500, 600};
        __u32 bulk_count = 3;

        // Update multiple entries in one go
        if (bpf_map_update_batch(fd, bulk_keys, bulk_values, &bulk_count, BPF_ANY) == 0) {
            printf("Batch update succeeded\n");
        } else {
            fprintf(stderr, "Batch update failed: %s\n", strerror(errno));
            close(fd);
            return 1;
        }

        // Now batch-delete them
        __u32 delete_count = 3;
        if (bpf_map_delete_batch(fd, bulk_keys, &delete_count, NULL) == 0) {
            printf("Batch delete succeeded\n");
        } else {
            fprintf(stderr, "Batch delete failed: %s\n", strerror(errno));
            close(fd);
            return 1;
        }

        // Confirm deletion
        for (int i = 0; i < 3; i++) {
            int val;
            if (bpf_map_lookup_elem(fd, &bulk_keys[i], &val) == 0) {
                printf("Unexpectedly found key %d after batch deletion\n", bulk_keys[i]);
            } else if (errno == ENOENT) {
                printf("Confirmed key %d is removed\n", bulk_keys[i]);
            } else {
                fprintf(stderr, "Lookup error: %s\n", strerror(errno));
            }
        }

        close(fd);
        return 0;
    }
    return -1;
}
If successful, all three keys are removed. If an error occurs (for example, if one key does not exist), delete_count may be set to the number of successfully deleted keys before the error. In that case, you can handle partial success accordingly.
This approach is ideal when you need to clear out a subset of keys without performing multiple individual deletions.
There is no helper function for such operation.
BPF_MAP_FREEZE command converts the specified map into a read-only state. After freezing a map, no further updates or deletions can be performed using bpf() syscalls, although eBPF programs themselves can still read and, in some cases, modify certain fields if allowed by the map type. Freezing is useful when you have finished constructing or populating a map and want to ensure its contents remain stable.
The bpf_map_freeze function is a libbpf wrapper for BPF_MAP_FREEZE command and its prototype is:
int bpf_map_freeze(int fd)
To freeze a map:
#include <bpf/libbpf.h>
#include <bpf/bpf.h>
#include <errno.h>
#include <unistd.h>

int create_hash_map(void) {
    int fd = bpf_map_create(BPF_MAP_TYPE_HASH, "hash_map_example",
                            sizeof(int),      // key_size
                            sizeof(int),     // value_size
                            1024,             // max_entries
                            NULL);            // map_flags
    if (fd < 0) {
        fprintf(stderr, "Failed to create hash map: %s\n", strerror(errno));
    }
    return fd;
}

int main() {
    int fd = create_hash_map();
    if (fd >= 0) {
        printf("Hash map created successfully with fd: %d\n", fd);


	    // Insert an entry (10->100)
	    int key = 10;
	    int value = 100;
	    if (bpf_map_update_elem(fd, &key, &value, BPF_ANY) == 0) {
            printf("Element inserted or updated successfully: key = %d, value = %ld\n", key, value);
        } else {
            fprintf(stderr, "Failed to insert or update element: %s\n", strerror(errno));
            return -1;
        }

	    // Freeze the map to prevent further updates
	    if (bpf_map_freeze(fd) == 0) {
	        printf("Map is now frozen and read-only\n");
	    } else {
	        perror("bpf_map_freeze");
	        return 1;
	    }

	    // Attempting to update after freezing should fail
	    int new_val = 200;
	    if (bpf_map_update_elem(fd, &key, &new_val, BPF_ANY) != 0) {
	        if (errno == EPERM) {
	            printf("Update failed, map is frozen\n");
	        } else {
	            perror("bpf_map_update_elem");
	        }
	    } else {
	        printf("Unexpected success, map should have been frozen\n");
	    }
	    close(fd);
	    return 0;
	}
	return -1;
}
After this call, attempts to update or delete elements through bpf_map_update_elem or bpf_map_delete_elem will fail with EPERM. This ensures that user-space cannot inadvertently modify the map’s contents, making it a suitable mechanism for finalizing configuration or ensuring data integrity.
Hash map created successfully with fd: 3
Element inserted or updated successfully: key = 10, value = 100
Map is now frozen and read-only
Update failed, map is frozen
There is no helper function for such operation.
BPF_OBJ_PIN command allows you to pin a map (or other eBPF objects like programs) to a location in the eBPF filesystem (/sys/fs/bpf by default). Pinning makes the map accessible to other processes after the original process that created it terminates, thereby extending the map’s lifetime beyond that of a single application.
The bpf_obj_pin_opts function is a libbpf wrapper for BPF_OBJ_PIN command and its prototype is:
int bpf_obj_pin_opts(int fd, const char *pathname, const struct bpf_obj_pin_opts *opts)
/sys/fs/bpf/my_map:
#include <bpf/libbpf.h>
#include <bpf/bpf.h>
#include <errno.h>
#include <unistd.h>

int create_hash_map(void) {
    int fd = bpf_map_create(BPF_MAP_TYPE_HASH, "hash_map_example",
                            sizeof(int),      // key_size
                            sizeof(int),     // value_size
                            1024,             // max_entries
                            NULL);            // map_flags
    if (fd < 0) {
        fprintf(stderr, "Failed to create hash map: %s\n", strerror(errno));
    }
    return fd;
}

int main() {
    int fd = create_hash_map();
    if (fd >= 0) {
        printf("Hash map created successfully with fd: %d\n", fd);


	    // Prepare arrays of keys and values
	    int bulk_keys[3] = {40, 50, 60};
	    int bulk_values[3] = {400, 500, 600};
	    __u32 bulk_count = 3;

	    // Update multiple entries in one go
	    if (bpf_map_update_batch(fd, bulk_keys, bulk_values, &bulk_count, BPF_ANY) == 0) {
	        printf("Batch update succeeded\n");
	    } else {
	        fprintf(stderr, "Batch update failed: %s\n", strerror(errno));
	        return 1;
	    }

	    // Pin the map to the BPF filesystem
	    const char *pin_path = "/sys/fs/bpf/my_map";
	    if (bpf_obj_pin(fd, pin_path) == 0) {
	        printf("Map pinned at %s\n", pin_path);
	    } else {
	        perror("bpf_obj_pin");
	        return 1;
	    }
	    close(fd);
	    return 0;
	}
	return -1;
}
Here, we create a map, insert (20->200), and pin it to /sys/fs/bpf/my_map. After pinning, we can safely close the file descriptor without losing the map. The map remains accessible at the pin path, allowing other processes to open it later.
fd in the current process does not destroy the map. It persists at /sys/fs/bpf/my_map until unlinked or until the system reboots.
There is no helper function for such operation.
BPF_OBJ_GET command retrieves a file descriptor for a previously pinned map, allowing a separate process to access and interact with that map. This facilitates sharing eBPF maps between multiple processes or restoring access to the map after the original creating process has exited.
The bpf_obj_get function is a libbpf wrapper for BPF_OBJ_GET command and its prototype is:
int bpf_obj_get(const char *pathname)
By calling bpf_obj_get(path), you open a reference to the pinned map from the filesystem path. Let’s get the previous map /sys/fs/bpf/my_map
#include <bpf/libbpf.h>
#include <bpf/bpf.h>
#include <errno.h>
#include <unistd.h>

int main() {
    const char *pin_path = "/sys/fs/bpf/my_map";

    // Open the pinned map
    int pinned_map_fd = bpf_obj_get(pin_path);
    if (pinned_map_fd < 0) {
        perror("bpf_obj_get");
        return 1;
    }
    printf("Opened pinned map from %s\n", pin_path);

    // Verify the map's content
    int key = 50;
    int val = 0;
    if (bpf_map_lookup_elem(pinned_map_fd, &key, &val) == 0) {
        printf("Retrieved value %d for key %d from pinned map\n", val, key);
    } else {
        perror("bpf_map_lookup_elem");
    }

    close(pinned_map_fd);
    return 0;
}
This program assumes that a map was previously pinned at /sys/fs/bpf/my_map. Calling bpf_obj_get opens a file descriptor to that map. We then retrieve (50->500) that was inserted in the previous example, confirming that the pinned map persists across processes.
Opened pinned map from /sys/fs/bpf/my_map
Retrieved value 500 for key 50 from pinned map
If successful, pinned_map_fd can be used just like any other map file descriptor. This is essential for long-running services or tools that need persistent state maintained across restarts, or for sharing data structures between different components of a system.
There is no helper function for such operation.
I know it can be challenging to wrap your head around the differences between eBPF user-space code and kernel-space eBPF programs. Bear with me—soon we’ll see eBPF programs in action, including maps and map operations, and everything will start to click!
Understanding eBPF’s capabilities is a thorough grasp of eBPF program types. Each eBPF program type represents a different interface or hook point in the kernel’s workflow. By selecting a particular program type when loading an eBPF program, the user defines the program’s environment: which kernel functions or events it can attach to, what kinds of data structures it can access, and which kernel helper functions can be called. Understanding these program types is crucial, because eBPF is not a one-size-fits-all technology. Instead, it offers a toolkit of specialized hooks, each tailored to a specific domain within the kernel.
In the Linux kernel source code, eBPF program types are listed in the UAPI header file include/uapi/linux/bpf.h. This header file provides an enumeration called enum bpf_prog_type that declares all the recognized program types.
enum bpf_prog_type {
	BPF_PROG_TYPE_UNSPEC,
	BPF_PROG_TYPE_SOCKET_FILTER,
	BPF_PROG_TYPE_KPROBE,
	BPF_PROG_TYPE_SCHED_CLS,
	BPF_PROG_TYPE_SCHED_ACT,
	BPF_PROG_TYPE_TRACEPOINT,
	BPF_PROG_TYPE_XDP,
	BPF_PROG_TYPE_PERF_EVENT,
	BPF_PROG_TYPE_CGROUP_SKB,
	BPF_PROG_TYPE_CGROUP_SOCK,
	BPF_PROG_TYPE_LWT_IN,
	BPF_PROG_TYPE_LWT_OUT,
	BPF_PROG_TYPE_LWT_XMIT,
	BPF_PROG_TYPE_SOCK_OPS,
	BPF_PROG_TYPE_SK_SKB,
	BPF_PROG_TYPE_CGROUP_DEVICE,
	BPF_PROG_TYPE_SK_MSG,
	BPF_PROG_TYPE_RAW_TRACEPOINT,
	BPF_PROG_TYPE_CGROUP_SOCK_ADDR,
	BPF_PROG_TYPE_LWT_SEG6LOCAL,
	BPF_PROG_TYPE_LIRC_MODE2,
	BPF_PROG_TYPE_SK_REUSEPORT,
	BPF_PROG_TYPE_FLOW_DISSECTOR,
	BPF_PROG_TYPE_CGROUP_SYSCTL,
	BPF_PROG_TYPE_RAW_TRACEPOINT_WRITABLE,
	BPF_PROG_TYPE_CGROUP_SOCKOPT,
	BPF_PROG_TYPE_TRACING,
	BPF_PROG_TYPE_STRUCT_OPS,
	BPF_PROG_TYPE_EXT,
	BPF_PROG_TYPE_LSM,
	BPF_PROG_TYPE_SK_LOOKUP,
	BPF_PROG_TYPE_SYSCALL, /* a program that can execute syscalls */
	BPF_PROG_TYPE_NETFILTER,
	__MAX_BPF_PROG_TYPE
};
When the user invokes the bpf() system call with the BPF_PROG_LOAD command, they specify one of these types. The kernel’s eBPF subsystem, including the verifier and the JIT compiler, then interprets the program according to the type requested. This choice determines what the program can do and which kernel functions it can safely interact with.
For example, when an operator writes an eBPF program that inspects network packets at a very early stage, they will choose the XDP (eXpress Data Path) program type. When performing dynamic tracing of kernel functions, they might use a kprobe or tracepoint program type. For building network firewalls or address-based restrictions at the cgroup level, they might opt for cgroup-related program types. Thus, each program type stands at the intersection of kernel events, context definitions, and allowed helper functions. This allows eBPF to cover a wide range of kernel instrumentation and customization scenarios while maintaining a strong safety and verification model.
It is also important to understand that each eBPF program type has a well-defined context structure and is closely tied to specific kernel functions or subsystems. For example, a socket filter program interacts with the socket layer, and the kernel provides a context structure (such as struct __sk_buff) that the eBPF program can read and manipulate. Similarly, a kprobe program type interacts with kernel functions specified by the user, and the kernel exposes function arguments through a context representing CPU registers. While kernel code is typically written in C, with some assembly and domain-specific macros, the eBPF environment operates as a restricted virtual machine inside the kernel, ensuring safety through static verification.
These eBPF programs can be attached to different types of events in the kernel, which defines where and when the program is executed. While many program types have a default attachment point deduced from the program type itself, some can attach to multiple locations in the kernel. In these cases, the attachment type must be explicitly specified to ensure the program is hooked to the correct event, such as a specific tracepoint. This distinction between program types and attachment types allows for greater flexibility and precision in how eBPF programs interact with kernel functions and events.
The following table, sourced from the kernel manual for libbpf, outlines the various eBPF program types and ELF section names. For more details, you can refer to the official documentation.
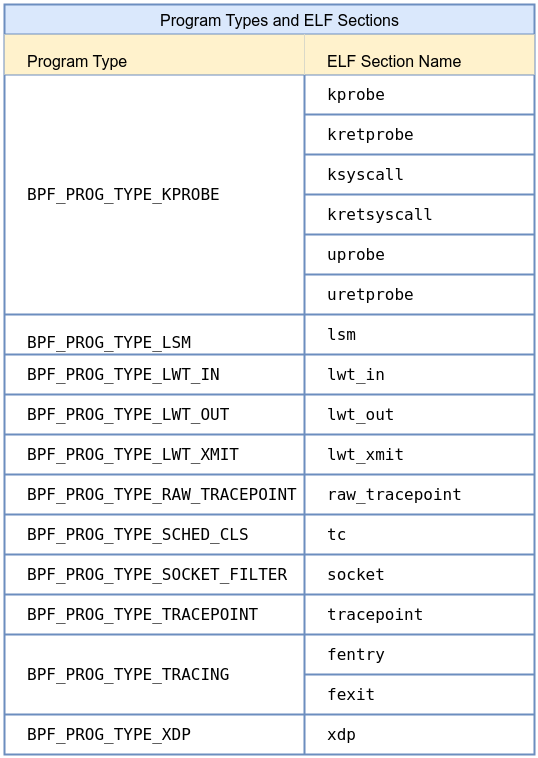
Sleepable eBPF programs are programs that are allowed to sleep during execution, marked by the BPF_F_SLEEPABLE flag. These programs are typically limited to specific types, such as security or tracing programs, while most other eBPF programs cannot sleep due to performance and safety reasons.
Before diving into specific program types, it is worth noting what a kernel function means in this context. The Linux kernel exports a wide range of functions, some internal and some available as hooks or tracepoints. Traditional kernel development would require a developer to write a loadable kernel module (LKM) and link it against these kernel functions, potentially breaking stability. With eBPF, however, the developer attaches to these kernel functions or kernel events indirectly, through stable, well-defined interfaces like kprobes, tracepoints, or security hooks. The kernel function from the perspective of an eBPF developer is usually a point in the kernel’s execution flow where they can gain insight or exert minimal influence.
eBPF provides indirect access through safe, monitored gateways rather than direct manipulation of kernel symbols, ensuring that even when instrumentation is performed at runtime, kernel stability and security remain intact. We have the full list of eBPF program types here. Now, let’s dive into the ones used most often.
One of the earliest and most foundational uses of eBPF is the socket filter program type. Historically, classic BPF (cBPF) was introduced for socket filtering, allowing a user program to attach a small filtering program to a raw socket. With eBPF, the socket filter functionality is extended to a more versatile and powerful environment.
A SOCKET_FILTER type program executes whenever a packet arrives at the socket it is attached to. Its context is a struct __sk_buff, a data structure defined in the kernel’s networking subsystem. This structure represents the packet’s metadata: its length, protocol, and pointers to the packet’s head and tail within the kernel’s networking stack. When the socket filter program runs, it can inspect packet headers, check IP addresses, transport layer ports, or even packet payload data.
In the kernel source code, the logic that associates a BPF program with a socket can be found in networking-related files, such as net/core/filter.c. The kernel functions involved in socket receive paths ultimately invoke the attached eBPF program. While the developer never directly calls these kernel functions from user space, understanding that the bpf() syscall with BPF_PROG_LOAD installs a filter that the kernel will call on packet reception helps conceptualize how kernel and eBPF code interact.
Kprobes are a kernel mechanism that allows the insertion of breakpoints into running kernel code for debugging and tracing. A KPROBE type eBPF program leverages this mechanism to execute whenever a specified kernel function is called. The corresponding kernel functions providing this capability are found in kernel/kprobes.c and related source files. Although these are low-level kernel features, from a user’s perspective, attaching a kprobe-based eBPF program is a matter of specifying the function name and loading the program with the correct type and section name (such as SEC("kprobe/…")).
When the kernel hits the probed function, it automatically invokes the attached eBPF program. Inside the eBPF program, the context may provide access to the registers and arguments of that kernel function call. Unlike a static interface, a kprobe can be attached to almost any kernel function symbol, enabling dynamic and powerful instrumentation. This is especially useful for performance analysis, debugging kernel behavior, or collecting usage statistics for particular kernel subsystems.
For instance, consider a scenario where the user wants to monitor file opens in the kernel by probing the do_sys_open function. By attaching a kprobe eBPF program to this function, it becomes possible to log every file open event, record the filename argument, and store it in eBPF map keyed by process ID. In user space, an operator can retrieve this data to understand which processes are touching which files over time. Previously, achieving this level of detail would require recompiling the kernel with special instrumentation or using heavyweight tools. With eBPF kprobes, it is dynamic, safe, and efficient.
While kprobes attach to arbitrary kernel functions, tracepoints represent a set of pre-defined static instrumentation points placed throughout the kernel. Tracepoints are designed by kernel developers and maintainers to provide stable, versioned interfaces for tracing particular events. They might mark the start or end of a scheduling operation, the completion of I/O operations, or the invocation of certain subsystems.
A TRACEPOINT type eBPF program, when loaded and attached to a specific tracepoint event, is guaranteed a stable and well-defined context structure. For example, a tracepoint may provide the PID of the task involved in a scheduling event or the device number in a block I/O event. This stability makes tracepoints well-suited for long-term monitoring and performance analysis tools, because they are less prone to changes as the kernel evolves than raw function symbols.
A compelling application might be monitoring scheduling events to understand how often a particular process is context-switched. By attaching an eBPF tracepoint program to the sched_process_exec tracepoint, the user can record every time a new process executes, linking PIDs to command lines, and gathering metrics about system activity. This data can be streamed to user space and visualized or stored for later analysis. Because tracepoints are standardized, the same eBPF program code is likely to work across multiple kernel releases, enhancing maintainability and portability.
XDP, short for eXpress Data Path, is a revolutionary approach to packet processing. XDP programs run extremely early in the packet’s journey, often at the device driver level, before the kernel’s networking stack processes the packet. This positioning allows XDP programs to achieve exceptionally high performance, making them an attractive option for load balancing, denial-of-service protection, and advanced packet filtering.
In the kernel source code, XDP integration can be found in network driver code and in net/core/dev.c, where the kernel’s receive path logic is implemented. The kernel functions that handle packet arrival invoke the XDP hook, giving the XDP eBPF program direct access to the packet’s raw buffer and metadata. The eBPF code can then decide to drop, pass, redirect, or modify the packet in place, all with minimal overhead.
Consider a data center environment with a load balancer at the edge. By deploying an XDP eBPF program, the operator can inspect incoming packets and choose which backend server to forward them to, based on dynamic policies stored in maps. If a sudden attack occurs, the same XDP program can recognize malicious patterns and drop unwanted traffic immediately, preventing the kernel’s main networking stack from wasting CPU cycles. This ability to implement custom high-performance networking logic on the fly is one of the reasons XDP is considered a game-changer in Linux networking.
Linux’s perf subsystem provides powerful performance monitoring capabilities, including counting hardware events (cache misses, branch mispredictions), software events (task migrations, page faults), and custom tracepoints. By attaching an eBPF PERF_EVENT type program, developers can collect and process performance data in real time. The kernel code handling these events lives largely within the kernel/events/ directory, where the perf subsystem is implemented.
A PERF_EVENT type eBPF program can run periodically based on sampling events or be triggered by certain performance conditions. Once triggered, it can record the current instruction pointer, stack trace, or other metrics into eBPF map. User space can then use tools like bpftool or perf itself to retrieve this data and generate flame graphs, histograms, or other visualizations. The benefit of using eBPF here is the flexibility to implement custom logic within the kernel’s perf event callbacks, something that would be impossible or cumbersome without eBPF.
For example, a developer might sample the CPU at a fixed rate to capture instruction pointers and thereby build a statistical profile of the hottest code paths in a production system. With a PERF_EVENT eBPF program, this sampling can be done efficiently and continuously, helping identify performance bottlenecks and guiding optimization efforts without stopping the system or deploying debugging kernels.
Raw tracepoints are similar to standard tracepoints, but they give the eBPF program direct access to the raw event data before the kernel applies stable formatting or abstractions. In other words, a RAW_TRACEPOINT program deals with the tracepoint’s underlying arguments and data structures without the stable, versioned interface offered by regular tracepoints. Kernel code related to raw tracepoints can also be found in tracing subsystems, but these are often less documented or guaranteed.
While this makes RAW_TRACEPOINT programs more fragile, it also grants advanced users more flexibility. If a developer needs to instrument a kernel feature that does not have a stable tracepoint or must interpret tracepoint data in a custom way, a raw tracepoint provides that opportunity. As the kernel evolves, a raw tracepoint may require updates in the eBPF program to remain compatible, but for advanced instrumentation tasks, the raw access can be invaluable.
A possible use case is for low-level file system or memory management events that have not been given stable tracepoint formats. By attaching a RAW_TRACEPOINT eBPF program to a kernel event, the user can parse the raw data structures themselves, extracting fields that normal tracepoints would not expose.
Cgroup socket address programs integrate eBPF with Linux control groups (cgroups), providing the ability to enforce network policies at a container or service level. When a process inside a particular cgroup attempts to bind or connect a socket, the attached eBPF program runs. This allows administrators to define policies that restrict which IP addresses or ports a cgrouped process may use.
The kernel code that integrates eBPF with cgroups lives in kernel/cgroup and net/core/sock.c, among other places. By setting BPF_PROG_TYPE_CGROUP_SOCK_ADDR, the user signals that the program will be invoked at the socket layer whenever an address operation occurs. In the program, the context provides access to the requested IP and port. The eBPF code can then check these values against a map of allowed destinations and return a decision—permit or deny. This approach is more dynamic and fine-grained than static firewall rules, and it fits seamlessly into containerized environments where cgroups define the boundaries of service-level isolation.
For instance, if an operator wants to ensure that a container running a certain microservice can only connect to a backend database cluster and nowhere else, a cgroup sock address eBPF program can implement this logic. By updating the map of allowed addresses in real time, the operator can adapt policies as the network environment changes, without having to restart the containers or adjust complicated firewall configurations. This helps build more secure, isolated, and manageable service ecosystems.
The kernel uses a flow dissector to classify packets into flows for features like packet steering, hashing, and load balancing. By default, this classification might rely on a standard tuple of IP addresses and ports. However, in complex environments, administrators may need custom logic to handle encapsulation protocols, new transport protocols, or proprietary headers.
A FLOW_DISSECTOR type eBPF program allows customization of the kernel’s flow classification logic. Inside the kernel source, flow dissector code can be found in files like net/core/flow_dissector.c. By loading a FLOW_DISSECTOR eBPF program, the user can instruct the kernel how to parse packet headers and extract keys differently than the default code. This can be crucial in environments that rely heavily on tunneling or need specialized hashing strategies.
Imagine a data center that uses a custom tunnel header format for internal traffic. Without eBPF, the kernel’s flow classification might fail to distinguish different flows correctly, leading to poor load balancing and performance. With a FLOW_DISSECTOR eBPF program, the operator can parse these custom headers and properly hash flows across multiple CPUs or network paths.
While most eBPF program types are focused on reading data and making decisions, RAW_TRACEPOINT_WRITABLE introduces a scenario where the program can potentially modify certain event data. This is advanced feature, allowing the developer to experiment with kernel events and, in some cases, adjust parameters or fields as they are passed to kernel subsystems. The relevant code is tightly integrated with the tracing subsystem, and due to the risk and complexity involved, the kernel imposes strict verification rules to ensure this does not compromise stability.
A RAW_TRACEPOINT_WRITABLE eBPF program might be used in highly specialized debugging scenarios, where a developer needs to simulate unusual conditions or override fields to test kernel behavior. Because this feature is neither common nor intended for typical production use, it is rarely encountered by average eBPF practitioners.
Linux Security Modules (LSMs) are a mechanism by which security frameworks like SELinux or AppArmor integrate with the kernel to enforce access control policies. With eBPF’s introduction, it became possible to write LSM policies dynamically. By choosing BPF_PROG_TYPE_LSM, the developer can attach eBPF programs to LSM hooks, allowing them to implement custom security policies without patching or rebuilding the kernel.
The kernel’s security subsystem defines a variety of hooks for filesystem operations, network accesses, and system call checks. Attaching an LSM eBPF program means that whenever a protected operation occurs—such as opening a file, creating a socket, or executing a binary—the eBPF code runs to decide whether to permit or deny the action. This approach blends eBPF’s runtime adaptability with the kernel’s security framework.
A straightforward example might be a scenario where a particular container should never read from a certain sensitive file or directory. By attaching an LSM eBPF program to the relevant file-open hook, the system can block any open attempts that violate this policy. If conditions change (say the file’s allowed access pattern must be updated), the administrator can simply update the eBPF map or reload the LSM program. This transforms what was once a static policy configuration into a dynamic, code-driven security model.
Netfilter is the framework underlying most Linux firewall and NAT functionalities. Historically configured via iptables or nftables, Netfilter provides hooks at various stages of packet traversal within the kernel’s networking stack. By writing a NETFILTER type eBPF program, the developer can plug into these hooks and implement dynamic, programmable firewall rules and packet handling logic.
In kernel source code, netfilter hooks are spread across the net/ipv4, net/ipv6, and net/netfilter directories. Attaching an eBPF program at these hooks allows rewriting packets, filtering them according to complex criteria, or even performing custom NAT logic. Unlike static Netfilter rules, which rely on limited matching conditions and actions, an eBPF NETFILTER program can execute arbitrary logic, consult eBPF maps for dynamically updated policies, and integrate seamlessly with other eBPF components like XDP or cgroup hooks.
For instance, a complex multi-tenant environment might require distinct firewall policies per tenant that evolve as services change. By storing these policies in maps and using a NETFILTER eBPF program, the operator can update them at runtime, achieving a level of flexibility and programmability that static rules cannot offer. As the kernel continues to integrate eBPF more deeply into its subsystems, NETFILTER type programs are poised to become a powerful complement or even replacement for traditional firewall configurations.
We don’t need to explain the Attach Types because they are abstracted away when using libbpf. It automatically sets the proper attachment based on the program type and ELF section name.
Don’t worry if you don’t fully understand everything just yet or can’t see the big picture—by working through the examples in the next chapter, the concepts will become much clearer. We will explore practical examples of eBPF programs and their interaction with various kernel events, demonstrating how to apply the concepts we’ve covered and providing hands-on experience with attaching eBPF programs to real-world events.
When writing eBPF code, you typically need to write two separate parts: one for kernel-space and the other for user-space.
Kernel Space Code:
The kernel-space code is responsible for performing specific tasks, such as tracing, monitoring network packets, filtering system calls, or attaching to kprobes, tracepoints, etc. This code interacts directly with the kernel and can access kernel data structures or events. The kernel space is highly sensitive, so the code running there must be safe and efficient. The kernel-space code is written in a special eBPF-compatible language (with a C-like syntax) and is loaded into the kernel using helper libraries (such as libbpf) or system calls (like bpf()).
User Space Code: User-space code is responsible for loading the eBPF program into the kernel, attaching it to specific hooks or events, and managing communication between user space and kernel space. It also handles tasks like retrieving data from the kernel (e.g., using maps for data storage). User-space code is written in a regular programming language (such as C or Python) and runs outside the kernel, as a user-space application.

libbpf is a C-based library designed to facilitate interaction with the eBPF subsystem in the Linux kernel. It provides a set of high-level and low-level APIs that simplify of loading, verifying, and managing eBPF programs. By handling the complexities of working with the kernel, libbpf enables developers to focus more on optimizing their eBPF code’s performance and correctness, rather than managing the details of user-space and kernel-space interactions.
libbpf includes a variety of BPF helper functions that ease development. These helpers allow eBPF programs to interact with the system more effectively, providing functions for tasks like debugging, manipulating network packets, and working with eBPF maps. This reduces the amount of code developers need to write, enabling them to focus on the logic of their BPF programs.
One of the most significant benefits of libbpf is its support for eBPF CO-RE (Compile Once, Run Everywhere), a mechanism that enhances the portability of eBPF programs. By leveraging BTF (BPF Type Format)—a metadata format that describes kernel data types such as data structures, unions, enums, and function prototypes—libbpf allows developers to write eBPF programs that can be compiled once and run across multiple kernel versions. CO-RE produces an ELF file with precompiled eBPF bytecode that can run across different kernel versions, eliminating the need for recompiling or modifying eBPF code for different systems. BTF information can be generated via
sudo bpftool btf dump file /sys/kernel/btf/vmlinux format c > vmlinux.h
Simply, libbpf uses BTF information to align or modify the types and fields in the eBPF program with the current running kernel. For more information about eBPF CO-RE, please refer to this post.
As stated in kernel documentation
libbpf provides APIs that user space programs can use to manipulate the BPF programs by triggering different phases of a BPF application lifecycle.

The following section provides a brief overview of each phase in the BPF life cycle:

Open phase: In this phase, libbpf parses the BPF object file and discovers BPF maps, BPF programs, and global variables. After a BPF app is opened, user space apps can make additional adjustments (setting BPF program types, if necessary; pre-setting initial values for global variables, etc.) before all the entities are created and loaded.

Load phase: In the load phase, libbpf creates BPF maps, resolves various relocations, and verifies and loads BPF programs into the kernel. At this point, libbpf validates all the parts of a BPF application and loads the BPF program into the kernel, but no BPF program has yet been executed. After the load phase, it’s possible to set up the initial BPF map state without racing with the BPF program code execution.

Attachment phase: In this phase, libbpf attaches BPF programs to various BPF hook points (e.g., tracepoints, kprobes, cgroup hooks, network packet processing pipeline, etc.). During this phase, BPF programs perform useful work such as processing packets, or updating BPF maps and global variables that can be read from user space.

Tear down phase: In the tear down phase, libbpf detaches BPF programs and unloads them from the kernel. BPF maps are destroyed, and all the resources used by the BPF app are freed.
A BPF Object Skeleton File is a C header file (.skel.h) generated using bpftool from a compiled eBPF object file. This header file provides a structured interface for interacting with the eBPF program, simplifying its management from user space. For developers seeking simplicity, the eBPF skeleton provides a more abstracted interface for interacting with eBPF programs. The skeleton generates functions such as <name>__open(), <name>__load(), <name>__attach(), and <name>__destroy(), which automate key steps in the eBPF lifecycle, allowing developers to manage eBPF programs with less effort. The skeleton also provides access to global variables and maps, which are directly accessible as structured fields in the user-space program, making it easier to manipulate these elements without relying on string-based lookups.
eBPF probes are mechanisms used to attach eBPF programs to specific events within the kernel or user-space. These probes allow developers to dynamically hook into various parts of the system and execute eBPF programs when those events or locations are triggered, enabling data collection, behavior monitoring, or influencing execution.
eBPF probes allow attaching to various points in the kernel’s execution flow to observe and sometimes modify behavior. Each type of eBPF probe corresponds to a particular attachment point. Some common probe types include:
A kprobe is a dynamic instrumentation mechanism that allows you to attach a custom handler at almost any kernel instruction address, often used at the start of a kernel function. When the CPU executes this probed instruction, it triggers the kprobe handler. This handler can inspect CPU registers, function arguments, and kernel memory state before the original instruction executes. kprobe-based eBPF programs are classified under the program type BPF_PROG_TYPE_KPROBE.
You can list all of the kernel exported symbols using sudo cat /proc/kallsyms and we are only interested in T which represents globally visible text symbols (Code) and they can be attached.
do_mkdirat), the kernel replaces the first instruction bytes at that function’s entry with a breakpoint instruction int3.Before kprobe:

After kprobe insertion:
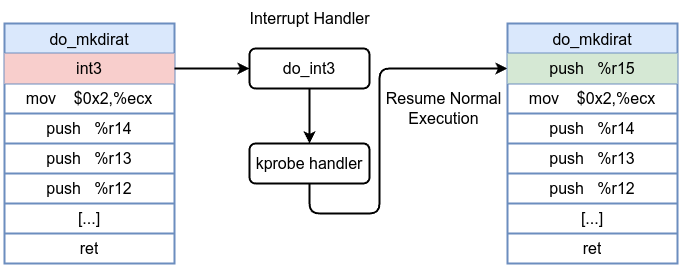
As stated in eBPF Docs
The context passed to kprobe programs is `struct pt_regs`. This structure is different for each CPU architecture since it contains a copy of the CPU registers at the time the kprobe was invoked.

It is common for kprobe programs to use the macros from the Libbpf `bpf_tracing.h` header file, which defines `PT_REGS_PARM1` ... `PT_REGS_PARM5` as well as a number of others. These macros will translate to the correct field in `struct pt_regs` depending on the current architecture. Communicating the architecture you are compiling the BPF program for is done by defining one of the `__TARGET_ARCH_*` values in your program or via the command line while compiling.
PT_REGS_PARMX macros are defined in bpf_tracing.h
#define PT_REGS_PARM1(x) (__PT_REGS_CAST(x)->__PT_PARM1_REG)
#define PT_REGS_PARM2(x) (__PT_REGS_CAST(x)->__PT_PARM2_REG)
#define PT_REGS_PARM3(x) (__PT_REGS_CAST(x)->__PT_PARM3_REG)
#define PT_REGS_PARM4(x) (__PT_REGS_CAST(x)->__PT_PARM4_REG)
#define PT_REGS_PARM5(x) (__PT_REGS_CAST(x)->__PT_PARM5_REG)
#define PT_REGS_PARM6(x) (__PT_REGS_CAST(x)->__PT_PARM6_REG)
#define PT_REGS_PARM7(x) (__PT_REGS_CAST(x)->__PT_PARM7_REG)
#define PT_REGS_PARM8(x) (__PT_REGS_CAST(x)->__PT_PARM8_REG)
struct pt_regs is defined in /arch/x86/include/uapi/asm/ptrace.h for the x86-64 architecture:
struct pt_regs {
	unsigned long r15;
	unsigned long r14;
	unsigned long r13;
	unsigned long r12;
	unsigned long rbp;
	unsigned long rbx;
	unsigned long r11;
	unsigned long r10;
	unsigned long r9;
	unsigned long r8;
	unsigned long rax;
	unsigned long rcx;
	unsigned long rdx;
	unsigned long rsi;
	unsigned long rdi;
	unsigned long orig_rax;
	unsigned long rip;
	unsigned long cs;
	unsigned long eflags;
	unsigned long rsp;
	unsigned long ss;
};
The struct pt_regs stores the CPU’s register state at the time of an interrupt, system call, or exception, enabling the kernel to save and restore the execution context of a process. By capturing the state of general-purpose registers, segment registers, and special registers (such as the instruction pointer and stack pointer).
In the next example we will attach a kprobe to start of of do_mkdirat syscall which is used to create a new directory.
do_mkdirat prototype is int do_mkdirat(int dfd, struct filename *name, umode_t mode); and it has 3 parameters dfd, struct filename, mode.
dfd: stands for “directory file descriptor.” It specifies the directory relative to which the new directory should be created.
struct filename is a kernel data structure defined in /include/linux/fs.h
struct filename {
	const char		*name;	/* pointer to actual string */
	const __user char	*uptr;	/* original userland pointer */
	atomic_t		refcnt;
	struct audit_names	*aname;
	const char		iname[];
};
mode represents file permissions for the created directory.
Now let’s start with eBPF kernel code
#define __TARGET_ARCH_x86
#include "vmlinux.h"
#include <bpf/bpf_helpers.h>
#include <bpf/bpf_tracing.h>
#include <bpf/bpf_core_read.h>

char LICENSE[] SEC("license") = "GPL";

SEC("kprobe/do_mkdirat")
int kprobe_mkdir(struct pt_regs *ctx)
{
    pid_t pid;
    const char *filename;
    umode_t mode;

    pid = bpf_get_current_pid_tgid() >> 32;
    struct filename *name = (struct filename *)PT_REGS_PARM2(ctx);
    filename = BPF_CORE_READ(name, name);
	mode = PT_REGS_PARM3(ctx);

    bpf_printk("KPROBE ENTRY pid = %d, filename = %s, mode = %u\n", pid, filename,mode);

    return 0;
}
First, as we just explained that we need to define __TARGET_ARCH__XX according to your architecture then include vmlinux.h
#define __TARGET_ARCH_x86
#include "vmlinux.h"
#include <bpf/bpf_helpers.h>
#include <bpf/bpf_tracing.h>
#include <bpf/bpf_core_read.h>
bpf_core_read.h header file provides macros for reading data from kernel or user space in a way that is compatible with BPF CO-RE (Compile Once, Run Everywhere) such as BPF_CORE_READ macro.
char LICENSE[] SEC("license") = "GPL";
Then we added license we we discussed in the previous chapter
SEC("kprobe/do_mkdirat")
int kprobe_mkdir(struct pt_regs *ctx)
SEC It tells the compile what ELF section to put which is kprobe and where to attach it which is do_mkdirat. Then kprobe handler kprobe_mkdir that gets executed when do_mkdirat entry point is triggered.
struct pt_regs *ctx is the context passed to the eBPF program by the kernel. It contains information about the registers at the time the function was invoked, including the function arguments, return addresses. The ctx pointer will be used to extract these values.
pid = bpf_get_current_pid_tgid() >> 32;
bpf_get_current_pid_tgid() is an eBPF helper function that returns a 64-bit value, where:
PID, we shift the 64-bit value to the right by 32 bits (>> 32) to get just the process ID (PID) of the current process. struct filename *name = (struct filename *)PT_REGS_PARM2(ctx);
filename = BPF_CORE_READ(name, name);
PT_REGS_PARM2(ctx): As previously discussed, this is a macro used to extract the second argument of the function being probed. In this case, the second argument is a pointer to the filename structure, which is passed to the do_mkdirat function. struct filename *name: This line casts the second parameter (a pointer to struct filename) to the name variable. struct filename holds the path to the directory to be created.
BPF_CORE_READ(name, name): It uses the BPF_CORE_READ macro from the bpf_core_read.h header. This macro is a helper function designed to safely read fields from kernel structures in a way that is compatible with BPF CO-RE (Compile Once, Run Everywhere) and it’s necessary because kernel structures may change between different kernel versions, and BPF_CORE_READ ensures that the field name can be accessed in a manner that works across various kernel versions.
name field: In this case, the field name in struct filename holds the string representing the path of the directory to be created.
mode = PT_REGS_PARM3(ctx);
PT_REGS_PARM3(ctx): This macro extracts the third argument passed to do_mkdirat, which represents the mode (permissions) of the directory to be created.
bpf_printk("KPROBE ENTRY pid = %d, filename = %s, mode = %u\n", pid, filename,mode);
bpf_printk: This is an eBPF macro that allows printing formatted output to the kernel’s trace buffer, which is accessible via /sys/kernel/debug/tracing/trace_pipe. bpf_printk only supports up to 3 arguments.
At this point we need to compile this code into an object file using clang with help from bpftool.
sudo apt install linux-tools-$(uname -r) clang llvm libbpf-dev bpftool,vmlinux.h via sudo bpftool btf dump file /sys/kernel/btf/vmlinux format c > vmlinux.hclang -g -O2 -target bpf -c kprobe-mkdirat.bpf.c -o kprobe-mkdirat.o with debugging information (-g) and optimization level -O2. The -target bpf flag ensures that Clang compiles the code for the eBPF target architecture.sudo bpftool gen skeleton kprobe-mkdirat.o > kprobe-mkdirat.skel.h/usr/include/linux/types.h:5:10: fatal error: 'asm/types.h' file not found while compiling the eBPF kernel code , you can execute the command sudo ln -s /usr/include/x86_64-linux-gnu/asm /usr/include/asm.
Examining the generated object file llvm-objdump -h kprobe-mkdirat.o
kprobe-mkdirat.o: file format elf64-bpf
Sections:
Idx Name Size VMA Type
0 00000000 0000000000000000
1 .strtab 00000141 0000000000000000
2 .text 00000000 0000000000000000 TEXT
3 kprobe/do_mkdirat 000000a8 0000000000000000 TEXT
4 .relkprobe/do_mkdirat 00000010 0000000000000000
5 license 0000000d 0000000000000000 DATA
6 .rodata 00000031 0000000000000000 DATA
[...]
The generated object file kprobe-mkdirat.o has the file format ELF64-BPF, indicating it is a 64-bit ELF object file specifically for BPF (eBPF) code.
kprobe/do_mkdirat This is the section header where the actual eBPF program resides, as indicated by SEC("kprobe/do_mkdirat") in the code. This section contains the code that will be executed when the do_mkdirat kprobe is triggered.
Let’s move to the user-space code. The following code is derived from libbpf-bootstrap
#include <stdio.h>
#include <unistd.h>
#include <sys/resource.h>
#include <bpf/libbpf.h>
#include "kprobe-mkdirat.skel.h"
static int libbpf_print_fn(enum libbpf_print_level level, const char *format, va_list args)
{
return vfprintf(stderr, format, args);
}
int main(int argc, char **argv)
{
struct kprobe_mkdirat *skel;
int err;
libbpf_set_print(libbpf_print_fn);
skel = kprobe_mkdirat__open();
if (!skel) {
fprintf(stderr, "Failed to open BPF skeleton\n");
return 1;
}
err = kprobe_mkdirat__load(skel);
if (err) {
fprintf(stderr, "Failed to load and verify BPF skeleton\n");
goto cleanup;
}
err = kprobe_mkdirat__attach(skel);
if (err) {
fprintf(stderr, "Failed to attach BPF skeleton\n");
goto cleanup;
}
printf("Successfully started! Please run `sudo cat /sys/kernel/debug/tracing/trace_pipe` "
"to see output of the BPF programs.\n");
for (;;) {
fprintf(stderr, ".");
sleep(1);
}
cleanup:
kprobe_mkdirat__destroy(skel);
return -err;
}
Let’s divide the code
static int libbpf_print_fn(enum libbpf_print_level level, const char *format, va_list args)
{
return vfprintf(stderr, format, args);
}
A function for libbpf debug and error messages.
struct kprobe_mkdirat *skel;
declares a pointer skel to a structure kprobe_mkdirat, which represents the eBPF skeleton for the eBPF program attached to the do_mkdirat kprobe. This structure is used to manage the loading, attaching, and cleanup of the eBPF program.
skel = kprobe_mkdirat__open();
This function opens the eBPF skeleton for the kprobe_mkdirat program to set up the eBPF program, including its maps, and prepares it for loading.
err = kprobe_mkdirat__load(skel);
This function loads and verifies the eBPF program defined in the skeleton. It ensures that the eBPF code is valid and ready to be attached to the kernel.
err = kprobe_mkdirat__attach(skel);
This function attaches the eBPF program to the kernel’s kprobe at the do_mkdirat function. It makes the program active and starts tracing the specified kernel function.
kprobe_mkdirat__destroy(skel);
This function cleans up and frees resources used by the BPF skeleton. It detaches the program and destroys the associated maps and other resources.
All these functions (_open(), _load(), _attach(), and _destroy()) are automatically generated from the eBPF skeleton file. As we explained earlier that the skeleton file abstracts much of the complexity of interacting with BPF programs, making it much easier to build user-space code for managing and interacting with eBPF programs. It eliminates the need for manual setup and error handling, simplify the entire process.
To compile the user-space code, we use the following command: clang -o loader loader.c -lbpf. This compiles the loader.c file and links it with the libbpf library, producing an executable named loader.
To start the eBPF program, you can use the following command: sudo ./loader. This runs the compiled user-space program loader, which loads the eBPF program, attaches it to the kernel function (in this case, the do_mkdirat function via kprobes), and starts tracing the kernel function. The sudo is necessary because eBPF programs often require root privileges to attach to kernel functions or tracepoints.
libbpf: loading object 'kprobe_mkdirat' from buffer
libbpf: elf: section(3) kprobe/do_mkdirat, size 168, link 0, flags 6, type=1
libbpf: sec 'kprobe/do_mkdirat': found program 'kprobe_mkdir' at insn offset 0 (0 bytes), code size 21 insns (168 bytes)
libbpf: elf: section(4) .relkprobe/do_mkdirat, size 16, link 27, flags 40, type=9
libbpf: elf: section(5) license, size 13, link 0, flags 3, type=1
libbpf: license of kprobe_mkdirat is GPL
libbpf: elf: section(6) .rodata, size 49, link 0, flags 2, type=1
libbpf: elf: section(17) .BTF, size 1407, link 0, flags 0, type=1
libbpf: elf: section(19) .BTF.ext, size 284, link 0, flags 0, type=1
libbpf: elf: section(27) .symtab, size 384, link 1, flags 0, type=2
libbpf: looking for externs among 16 symbols...
libbpf: collected 0 externs total
libbpf: map 'kprobe_m.rodata' (global data): at sec_idx 6, offset 0, flags 80.
libbpf: map 0 is "kprobe_m.rodata"
libbpf: sec '.relkprobe/do_mkdirat': collecting relocation for section(3) 'kprobe/do_mkdirat'
libbpf: sec '.relkprobe/do_mkdirat': relo #0: insn #14 against '.rodata'
libbpf: prog 'kprobe_mkdir': found data map 0 (kprobe_m.rodata, sec 6, off 0) for insn 14
libbpf: loading kernel BTF '/sys/kernel/btf/vmlinux': 0
libbpf: map 'kprobe_m.rodata': created successfully, fd=4
libbpf: sec 'kprobe/do_mkdirat': found 3 CO-RE relocations
libbpf: CO-RE relocating [2] struct pt_regs: found target candidate [83] struct pt_regs in [vmlinux]
libbpf: prog 'kprobe_mkdir': relo #0: <byte_off> [2] struct pt_regs.si (0:13 @ offset 104)
libbpf: prog 'kprobe_mkdir': relo #0: matching candidate #0 <byte_off> [83] struct pt_regs.si (0:13 @ offset 104)
libbpf: prog 'kprobe_mkdir': relo #0: patched insn #3 (LDX/ST/STX) off 104 -> 104
libbpf: CO-RE relocating [7] struct filename: found target candidate [4878] struct filename in [vmlinux]
libbpf: prog 'kprobe_mkdir': relo #1: <byte_off> [7] struct filename.name (0:0 @ offset 0)
libbpf: prog 'kprobe_mkdir': relo #1: matching candidate #0 <byte_off> [4878] struct filename.name (0:0 @ offset 0)
libbpf: prog 'kprobe_mkdir': relo #1: patched insn #4 (ALU/ALU64) imm 0 -> 0
libbpf: prog 'kprobe_mkdir': relo #2: <byte_off> [2] struct pt_regs.dx (0:12 @ offset 96)
libbpf: prog 'kprobe_mkdir': relo #2: matching candidate #0 <byte_off> [83] struct pt_regs.dx (0:12 @ offset 96)
libbpf: prog 'kprobe_mkdir': relo #2: patched insn #12 (LDX/ST/STX) off 96 -> 96
Successfully started! Please run `sudo cat /sys/kernel/debug/tracing/trace_pipe` to see output of the BPF programs.
..............
To view the output of the eBPF program, you can open a separate terminal window and run the following command: sudo cat /sys/kernel/debug/tracing/trace_pipe
Then in another separate terminal run mkdir testing. In the second terminal, you should now see the following output:
mkdir-2173 [003] ...21 12952.686720: bpf_trace_printk: KPROBE ENTRY pid = 2173, filename = testing, mode = 511
mode = 511. The value 511 is the decimal representation of the octal permission 0777.
To observe the behavior of loading the eBPF program, you can run strace using the following command: sudo strace -ebpf ./loader. This will trace the bpf() system calls made by the loader program.
bpf(BPF_PROG_LOAD, {prog_type=BPF_PROG_TYPE_KPROBE, insn_cnt=21, insns=0x55f5e460a0f0, license="GPL", log_level=0, log_size=0, log_buf=NULL, kern_version=KERNEL_VERSION(6, 12, 12), prog_flags=0, prog_name="kprobe_mkdir", prog_ifindex=0, expected_attach_type=BPF_CGROUP_INET_INGRESS, prog_btf_fd=4, func_info_rec_size=8, func_info=0x55f5e4608850, func_info_cnt=1, line_info_rec_size=16, line_info=0x55f5e46088d0, line_info_cnt=9, attach_btf_id=0, attach_prog_fd=0, fd_array=NULL}, 148) = 5
The previous output tells us that the program type is BPF_PROG_TYPE_KPROBE in prog_type=BPF_PROG_TYPE_KPROBE, and prog_name="kprobe_mkdir" is the eBPF program that will be executed when the do_mkdirat entry point is triggered.

Congratulations! You’ve just run your first eBPF program, and it’s a portable eBPF program that can work across different kernel versions. It wasn’t that complicated, was it?
In eBPF kernel code, we used the name of the kprobe handler as kprobe_mkdir and passed a struct pt_regs as the context for the kprobe_mkdir function. Another approach is using BPF_KPROBE, which offers a more convenient and readable way to define kprobe handlers. With BPF_KPROBE, you specify the name of the function followed by any additional arguments you want to capture, making it a simpler and cleaner method.
#define __TARGET_ARCH_x86
#include "vmlinux.h"
#include <bpf/bpf_helpers.h>
#include <bpf/bpf_tracing.h>
#include <bpf/bpf_core_read.h>
char LICENSE[] SEC("license") = "GPL";
SEC("kprobe/do_mkdirat")
int BPF_KPROBE(capture_mkdir, int dfd, struct filename *name, umode_t mode)
{
pid_t pid;
const char *filename;
pid = bpf_get_current_pid_tgid() >> 32;
filename = BPF_CORE_READ(name, name);
bpf_printk("KPROBE ENTRY pid = %d, filename = %s, mode = %u\n", pid, filename, mode);
return 0;
}
This approach is more convenient and readable, while giving the same results. Either way, it’s up to you to choose which method is easier for you.
bpf(BPF_PROG_LOAD, {prog_type=BPF_PROG_TYPE_KPROBE, insn_cnt=22, insns=0x556e4ec810e0, license="GPL", log_level=0, log_size=0, log_buf=NULL, kern_version=KERNEL_VERSION(6, 12, 12), prog_flags=0, prog_name="capture_mkdir", prog_ifindex=0, expected_attach_type=BPF_CGROUP_INET_INGRESS, prog_btf_fd=4, func_info_rec_size=8, func_info=0x556e4ec7f840, func_info_cnt=1, line_info_rec_size=16, line_info=0x556e4ec7f8c0, line_info_cnt=8, attach_btf_id=0, attach_prog_fd=0, fd_array=NULL}, 148) = 5
Now let’s move forward to walkthrough kretprobe.
A kretprobe fires when a monitored function returns. While a kprobe targets function entry (or a specific instruction), a kretprobe targets function exit. By pairing a kprobe at function entry with a kretprobe at function exit, you can measure how long a function took to run or check its return value. kretprobe-based eBPF programs are also classified under the program type BPF_PROG_TYPE_KPROBE
Before kretprobe:
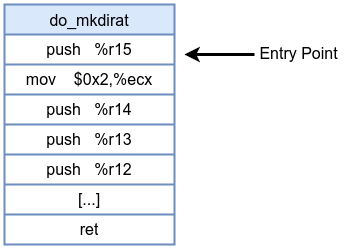
After kretprobe insertion:

Now let’s take a look at the same example by hooking kretprobe to do_mkdirat. First, Let’s look at the eBPF kernel code.
#define __TARGET_ARCH_x86
#include "vmlinux.h"
#include <bpf/bpf_helpers.h>
#include <bpf/bpf_tracing.h>
#include <bpf/bpf_core_read.h>
char LICENSE[] SEC("license") = "GPL";
SEC("kretprobe/do_mkdirat")
int kretprobe_mkdir(struct pt_regs *ctx)
{
pid_t pid;
pid = bpf_get_current_pid_tgid() >> 32;
long ret = PT_REGS_RC(ctx);
bpf_printk("KPROBE ENTRY pid = %d, return = %d\n", pid, ret);
return 0;
}
We changed SEC from ("kprobe/do_mkdirat") to ("kretprobe/do_mkdirat")
SEC("kretprobe/do_mkdirat")
int kretprobe_mkdir(struct pt_regs *ctx)
Using PT_REGS_RC macro to extract the return value form pt_regs structure. Macro PT_REGS_RC is defined in bpf_tracing.h as
#define PT_REGS_RC(x) (__PT_REGS_CAST(x)->__PT_RC_REG)
To compile we could do exactly the same as we did in the previous kprobe example.
vmlinux.h viasudo bpftool btf dump file /sys/kernel/btf/vmlinux format c > vmlinux.h
clang -g -O2 -target bpf -c kretprobe-mkdirat.bpf.c -o kretprobe-mkdirat.o with debugging information (-g) and optimization level -O2. The -target bpf flag ensures that Clang compiles the code for the eBPF target architecture.sudo bpftool gen skeleton kretprobe-mkdirat.o > kprobe-kretprobe.skel.h
Moving to the second part which is the user-space code for opening, loading, attaching and destroying the eBPF code, let’s use the the previous code and modify it.
#include <stdio.h>
#include <unistd.h>
#include <sys/resource.h>
#include <bpf/libbpf.h>
#include "kretprobe-mkdirat.skel.h"
static int libbpf_print_fn(enum libbpf_print_level level, const char *format, va_list args)
{
return vfprintf(stderr, format, args);
}
int main(int argc, char **argv)
{
struct kretprobe_mkdirat *skel;
int err;
libbpf_set_print(libbpf_print_fn);
skel = kretprobe_mkdirat__open();
if (!skel) {
fprintf(stderr, "Failed to open BPF skeleton\n");
return 1;
}
err = kretprobe_mkdirat__load(skel);
if (err) {
fprintf(stderr, "Failed to load and verify BPF skeleton\n");
goto cleanup;
}
err = kretprobe_mkdirat__attach(skel);
if (err) {
fprintf(stderr, "Failed to attach BPF skeleton\n");
goto cleanup;
}
printf("Successfully started! Please run `sudo cat /sys/kernel/debug/tracing/trace_pipe` "
"to see output of the BPF programs.\n");
for (;;) {
fprintf(stderr, ".");
sleep(1);
}
cleanup:
kretprobe_mkdirat__destroy(skel);
return -err;
}
We need to change some lines here to match out generated skeleton file such as
#include "kretprobe-mkdirat.skel.h"
struct kretprobe_mkdirat *skel;
skel = kretprobe_mkdirat__open();
err = kretprobe_mkdirat__load(skel);
err = kretprobe_mkdirat__attach(skel);
kretprobe_mkdirat__destroy(skel);
Finally, let’s compile it and link it to libbpf clang -o loader loader.c -lbpf then run it as the previous with sudo ./loader. Then sudo cat /sys/kernel/debug/tracing/trace_pipe in a separate terminal. Then use command mkdir test and we get
<...>-2053 [002] ...21 5359.243727: bpf_trace_printk: KPROBE ENTRY pid = 2053, return = 0
Return value 0 indicates success, while any non-zero value represents an error, with the specific error codes defined in /include/uapi/asm-generic/errno-base.h.
#define EPERM 1 /* Operation not permitted */
#define ENOENT 2 /* No such file or directory */
#define ESRCH 3 /* No such process */
#define EINTR 4 /* Interrupted system call */
#define EIO 5 /* I/O error */
#define ENXIO 6 /* No such device or address */
#define E2BIG 7 /* Argument list too long */
#define ENOEXEC 8 /* Exec format error */
#define EBADF 9 /* Bad file number */
#define ECHILD 10 /* No child processes */
#define EAGAIN 11 /* Try again */
#define ENOMEM 12 /* Out of memory */
#define EACCES 13 /* Permission denied */
#define EFAULT 14 /* Bad address */
#define ENOTBLK 15 /* Block device required */
#define EBUSY 16 /* Device or resource busy */
#define EEXIST 17 /* File exists */
#define EXDEV 18 /* Cross-device link */
#define ENODEV 19 /* No such device */
#define ENOTDIR 20 /* Not a directory */
#define EISDIR 21 /* Is a directory */
#define EINVAL 22 /* Invalid argument */
#define ENFILE 23 /* File table overflow */
#define EMFILE 24 /* Too many open files */
#define ENOTTY 25 /* Not a typewriter */
#define ETXTBSY 26 /* Text file busy */
#define EFBIG 27 /* File too large */
#define ENOSPC 28 /* No space left on device */
#define ESPIPE 29 /* Illegal seek */
#define EROFS 30 /* Read-only file system */
#define EMLINK 31 /* Too many links */
#define EPIPE 32 /* Broken pipe */
#define EDOM 33 /* Math argument out of domain of func */
#define ERANGE 34 /* Math result not representable */
For example, if you try to run mkdir test command again you will get the following output.
mkdir-2054 [003] ...21 5365.024388: bpf_trace_printk: KPROBE ENTRY pid = 2054, return = -17
This indicate EEXIST - file exists. Running it with strace sudo strace -ebpf ./loader to capture bpf() syscalls shows that the the prog_type is BPF_PROG_TYPE_KPROBE and the prog_name is kretprobe_mkdir
bpf(BPF_PROG_LOAD, {prog_type=BPF_PROG_TYPE_KPROBE, insn_cnt=11, insns=0x55eb0c2b8000, license="GPL", log_level=0, log_size=0, log_buf=NULL, kern_version=KERNEL_VERSION(6, 12, 12), prog_flags=0, prog_name="kretprobe_mkdir", prog_ifindex=0, expected_attach_type=BPF_CGROUP_INET_INGRESS, prog_btf_fd=4, func_info_rec_size=8, func_info=0x55eb0c2b67f0, func_info_cnt=1, line_info_rec_size=16, line_info=0x55eb0c2b6870, line_info_cnt=6, attach_btf_id=0, attach_prog_fd=0, fd_array=NULL}, 148) = 5
The better approach is to use BPF_KRETPROBE macro, which offers a more convenient and readable way to define kretprobe handlers, as mentioned earlier.
#define __TARGET_ARCH_x86
#include "vmlinux.h"
#include <bpf/bpf_helpers.h>
#include <bpf/bpf_tracing.h>
#include <bpf/bpf_core_read.h>
char LICENSE[] SEC("license") = "GPL";
SEC("kretprobe/do_mkdirat")
int BPF_KRETPROBE(do_mkdirat, int ret)
{
pid_t pid;
pid = bpf_get_current_pid_tgid() >> 32;
bpf_printk("KPROBE ENTRY pid = %d, return = %d\n", pid, ret);
return 0;
}
As you can see, this is much simpler and cleaner.
Combining the use of both kprobe and kretprobe on the do_mkdirat kernel function provides insight into the arguments received by do_mkdirat and its return value. This type of instrumentation is valuable for several reasons, such as debugging, system performance monitoring, maintaining a detailed record of directory creation for forensic analysis, and detecting malicious activities like attempting unauthorized directory creation.
/sys/kernel/debug/tracing/trace_pipe is globally shared interface that aggregates all ebpf programs trace events, which can lead to contention and data mixing. In contrast, using maps provides a dedicated, structured, and efficient mechanism to pass data between kernel and user space, offering better control and isolation.
Let’s go forward and use maps instead of the kernel’s trace buffer /sys/kernel/debug/tracing/trace_pipe. Using the first example and add BPF_MAP_TYPE_PERF_EVENT_ARRAY to it and store our data using bpf_perf_event_output in BPF perf event.

#define __TARGET_ARCH_x86
#include "vmlinux.h"
#include <bpf/bpf_helpers.h>
#include <bpf/bpf_tracing.h>
#include <bpf/bpf_core_read.h>
struct event {
pid_t pid;
char filename[256];
umode_t mode;
};
struct {
__uint(type, BPF_MAP_TYPE_PERF_EVENT_ARRAY);
__uint(max_entries, 1024);
__type(key, int);
__type(value, int);
} mkdir SEC(".maps");
char LICENSE[] SEC("license") = "GPL";
SEC("kprobe/do_mkdirat")
int BPF_KPROBE(do_mkdirat, int dfd, struct filename *name, umode_t mode)
{
pid_t pid = bpf_get_current_pid_tgid() >> 32;
struct event ev = {};
ev.pid = pid;
ev.mode = mode;
const char *filename = BPF_CORE_READ(name, name);
bpf_probe_read_str(ev.filename, sizeof(ev.filename), filename);
bpf_perf_event_output(ctx, &mkdir, BPF_F_CURRENT_CPU, &ev, sizeof(ev));
return 0;
}
First we defined the structure for the event data that will be sent to user-space.
struct event {
pid_t pid;
char filename[256];
umode_t mode;
};
Then defined a map of type BPF_MAP_TYPE_PERF_EVENT_ARRAY as we explained earlier.
struct {
__uint(type, BPF_MAP_TYPE_PERF_EVENT_ARRAY); // Type of BPF map
__uint(max_entries, 1024); // Maximum number of entries in the map
__type(key, int); // Type of the key
__type(value, int); // Type of the value
} mkdir SEC(".maps");
Then we created ev of type struct event and store both pid and mode
struct event ev = {};
ev.pid = pid;
ev.mode = mode;
Next, we used bpf_probe_read_str to safely read a string from kernel space and copy it into the eBPF program’s memory space.
bpf_probe_read_str(ev.filename, sizeof(ev.filename), filename);
Finally, write ev data into our created map mkdir.
bpf_perf_event_output(ctx, &mkdir, BPF_F_CURRENT_CPU, &ev, sizeof(ev));
The user-space loader code
#include <stdio.h>
#include <unistd.h>
#include <sys/resource.h>
#include <bpf/libbpf.h>
#include <bpf/bpf.h>
#include "kprobe-mkdirat.skel.h"
#define PERF_BUFFER_PAGES 64
static int libbpf_print_fn(enum libbpf_print_level level, const char *format, va_list args)
{
return vfprintf(stderr, format, args);
}
struct event {
pid_t pid;
char filename[256];
mode_t mode;
};
static void handle_event(void *ctx, int cpu, void *data, __u32 data_sz)
{
struct event *evt = (struct event *)data;
printf("Process ID: %d, filename: %s, mode: %d\n", evt->pid, evt->filename, evt->mode);
}
static void handle_lost_events(void *ctx, int cpu, __u64 lost_cnt)
{
fprintf(stderr, "Lost %llu events on CPU %d\n", lost_cnt, cpu);
}
int main(int argc, char **argv)
{
struct kprobe-mkdirat *skel;
struct perf_buffer *pb = NULL;
int err;
libbpf_set_print(libbpf_print_fn);
skel = kprobe-mkdirat__open();
if (!skel) {
fprintf(stderr, "Failed to open BPF skeleton\n");
return 1;
}
err = kprobe-mkdirat__load(skel);
if (err) {
fprintf(stderr, "Failed to load and verify BPF skeleton\n");
goto cleanup;
}
err = kprobe-mkdirat__attach(skel);
if (err) {
fprintf(stderr, "Failed to attach BPF skeleton\n");
goto cleanup;
}
pb = perf_buffer__new(bpf_map__fd(skel->maps.mkdir), PERF_BUFFER_PAGES, handle_event, handle_lost_events, NULL, NULL);
if (!pb) {
fprintf(stderr, "Failed to create perf buffer\n");
goto cleanup;
}
printf("Successfully started! Listening for events...\n");
while (1) {
err = perf_buffer__poll(pb, 100);
if (err < 0) {
fprintf(stderr, "Error polling perf buffer\n");
break;
}
}
cleanup:
perf_buffer__free(pb);
kprobe-mkdirat__destroy(skel);
return -err;
}
First we defined the structure to store event data.
struct event {
pid_t pid;
char filename[256];
umode_t mode;
};
Next, we defined handle_event which gets called when a new event is read from the perf buffer. It casts the data pointer to the struct event and prints the pid, filename, and mode values. Then, we defined handle_lost_events which handles lost events (when the buffer overflows). It prints a message indicating how many events were lost on a specific CPU.
static void handle_event(void *ctx, int cpu, void *data, __u32 data_sz)
{
struct event *evt = (struct event *)data;
printf("Process ID: %d, filename: %s, mode: %d\n", evt->pid, evt->filename, evt->mode);
}
static void handle_lost_events(void *ctx, int cpu, __u64 lost_cnt)
{
fprintf(stderr, "Lost %llu events on CPU %d\n", lost_cnt, cpu);
}
Then we Initialize pb to hold the perf buffer, struct perf_buffer is defined in /tools/lib/bpf/libbpf.c
struct perf_buffer *pb = NULL;
Next, we created a perf buffer for our perf array map BPF_MAP_TYPE_PERF_EVENT_ARRAY using perf_buffer__new and it has the following prototype
struct perf_buffer * perf_buffer__new (int map_fd, size_t page_cnt, perf_buffer_sample_fn sample_cb, perf_buffer_lost_fn lost_cb, void *ctx, const struct perf_buffer_opts *opts)
perf_buffer__new takes a file descriptor for BPF_MAP_TYPE_PERF_EVENT_ARRAY , memory page size for each CPU, a function to invoke on each each received data, a function to invoke in case of data loss, *ctx and *opts.
pb = perf_buffer__new(bpf_map__fd(skel->maps.mkdir), PERF_BUFFER_PAGES, handle_event, handle_lost_events, NULL, NULL);
if (!pb) {
fprintf(stderr, "Failed to create perf buffer\n");
goto cleanup;
}
perf_buffer__poll is a function provided by the libbpf library that allows user-space applications to poll a perf buffer for new data. It has the following prototype:
int perf_buffer__poll (struct perf_buffer *pb, int timeout_ms)
err = perf_buffer__poll(pb, 100);
If Positive timeout_ms: Blocks for the specified time (e.g., 100ms). If data arrives within that time, it processes and returns. If no data arrives, it returns 0.
Iftimeout_ms == 0: Non-blocking. Checks immediately for data. Returns 0 if no data is available.
If Negative timeout_ms: Blocks indefinitely until data becomes available.
Finally, free perf buffer resource.
perf_buffer__free(pb);
After compiling as we did before, run loader using sudo and run mkdir /tmp/test in a new terminal.
[...]
libbpf: CO-RE relocating [11] struct pt_regs: found target candidate [136] struct pt_regs in [vmlinux]
libbpf: prog 'do_mkdirat': relo #0: <byte_off> [11] struct pt_regs.si (0:13 @ offset 104)
libbpf: prog 'do_mkdirat': relo #0: matching candidate #0 <byte_off> [136] struct pt_regs.si (0:13 @ offset 104)
libbpf: prog 'do_mkdirat': relo #0: patched insn #1 (LDX/ST/STX) off 104 -> 104
libbpf: prog 'do_mkdirat': relo #1: <byte_off> [11] struct pt_regs.dx (0:12 @ offset 96)
libbpf: prog 'do_mkdirat': relo #1: matching candidate #0 <byte_off> [136] struct pt_regs.dx (0:12 @ offset 96)
libbpf: prog 'do_mkdirat': relo #1: patched insn #2 (LDX/ST/STX) off 96 -> 96
libbpf: CO-RE relocating [25] struct filename: found target candidate [1410] struct filename in [vmlinux]
libbpf: prog 'do_mkdirat': relo #2: <byte_off> [25] struct filename.name (0:0 @ offset 0)
libbpf: prog 'do_mkdirat': relo #2: matching candidate #0 <byte_off> [1410] struct filename.name (0:0 @ offset 0)
libbpf: prog 'do_mkdirat': relo #2: patched insn #73 (ALU/ALU64) imm 0 -> 0
libbpf: map 'mkdir': created successfully, fd=3
Successfully started! Listening for events...
Process ID: 2416, filename: /tmp/test, mode: 511
Tracing bpf() syscall using strace
[...]
bpf(BPF_MAP_CREATE, {map_type=BPF_MAP_TYPE_PERF_EVENT_ARRAY, key_size=4, value_size=4, max_entries=1024, map_flags=0, inner_map_fd=0, map_name="mkdir", map_ifindex=0, btf_fd=0, btf_key_type_id=0, btf_value_type_id=0, btf_vmlinux_value_type_id=0, map_extra=0}, 80) = 5
bpf(BPF_PROG_LOAD, {prog_type=BPF_PROG_TYPE_KPROBE, insn_cnt=96, insns=0x55cbcd994ff0, license="GPL", log_level=0, log_size=0, log_buf=NULL, kern_version=KERNEL_VERSION(6, 12, 12), prog_flags=0, prog_name="do_mkdirat", prog_ifindex=0, expected_attach_type=BPF_CGROUP_INET_INGRESS, prog_btf_fd=4, func_info_rec_size=8, func_info=0x55cbcd9937e0, func_info_cnt=1, line_info_rec_size=16, line_info=0x55cbcd9938c0, line_info_cnt=13, attach_btf_id=0, attach_prog_fd=0, fd_array=NULL}, 148) = 5
This output tells us that there an extra component which is BPF_MAP_CREATE command creating a map of type BPF_MAP_TYPE_PERF_EVENT_ARRAY and map_name is mkdir.
Attaching a kprobe to system call can be done using the same methods or using ksyscall technique with BPF_KSYSCALL macro and ("ksyscall/syscall_name") as section. For example, SEC("ksyscall/execve") as the next example, which we will attach a kprobe to execve syscall using ksyscall. The execve system call is one of the family of exec functions in Unix-like operating systems. It is used to execute a new program by replacing the current process image with a new one. The execve syscall is declared in include/linux/syscalls.h as the following:
asmlinkage long sys_execve(const char __user *filename,
const char __user *const __user *argv,
const char __user *const __user *envp);
asmlinkage: It’s a macro to tell the compile to that arguments are passed on the stack not registers.
const char __user *filename: A pointer to the filename (a user-space string) of the program to execute.
const char __user *const __user *argv: A pointer to an array of pointers (from user space) to the argument strings for the new program.
const char __user *const __user _*envp: A pointer to an array of pointers (from user space) to the environment variables for the new program.
In next example, we will attach kprobe to execve syscall using ksyscall and we will add ring buffer to ship our events to the user-space instead of perf buffer. Ring buffer needs to be defined, reserve then submit your events. The ring buffer minimizes overhead, offering lower latency and better performance for high-frequency event reporting compared to perf buffer mechanism.
#define __TARGET_ARCH_x86
#include "vmlinux.h"
#include <bpf/bpf_helpers.h>
#include <bpf/bpf_tracing.h>
#include <bpf/bpf_core_read.h>
#define MAX_ARGS 7
#define ARG_SIZE 128
struct event {
__u32 pid;
char path[ARG_SIZE];
char argv[MAX_ARGS][ARG_SIZE];
};
struct {
__uint(type, BPF_MAP_TYPE_RINGBUF);
__uint(max_entries, 1 << 16);
} rb SEC(".maps");
char LICENSE[] SEC("license") = "GPL";
SEC("ksyscall/execve")
int BPF_KSYSCALL(kprobe_sys_execve,
const char *filename,
const char *const *argv)
{
struct event *ev = bpf_ringbuf_reserve(&rb, sizeof(*ev), 0);
if (!ev)
return 0;
ev->pid = bpf_get_current_pid_tgid() >> 32;
bpf_probe_read_user_str(ev->path, sizeof(ev->path), filename);
#pragma unroll
for (int i = 0; i < MAX_ARGS; i++) {
const char *argp = NULL;
bpf_probe_read_user(&argp, sizeof(argp), &argv[i]);
if (!argp) {
break;
}
bpf_probe_read_user_str(ev->argv[i], sizeof(ev->argv[i]), argp);
}
bpf_ringbuf_submit(ev, 0);
return 0;
}
We defined a ring buffer type of map with name rb:
struct {
__uint(type, BPF_MAP_TYPE_RINGBUF);
__uint(max_entries, 1 << 16);
} rb SEC(".maps");
Define a data structure event
struct event {
__u32 pid;
char path[ARG_SIZE];
char argv[MAX_ARGS][ARG_SIZE];
};
We defined section with ksyscall/execve for execve syscall and use BPF_KSYSCALL macro. BPF_KSYSCALL macro defined two arguments of execve syscall instead of three because we only need filename to extract command being executed and argv to get command with its arguments and no need for environment variables.
SEC("ksyscall/execve")
int BPF_KSYSCALL(kprobe_sys_execve,
const char *filename,
const char *const *argv)
{
Then reserve space in eBPF ring buffer using bpf_ringbuf_reserve helper function which has prototype as the following void *bpf_ringbuf_reserve(void *ringbuf, u64 size, u64 flags), it take a pointer to a ring buffer definition as the first argument and the number of bytes to be reserved in the ring buffer as the second argument and returns a valid pointer with size bytes of memory available and flags must be 0.
struct event *ev = bpf_ringbuf_reserve(&rb, sizeof(*ev), 0);
if (!ev)
return 0;
bpf_probe_read_user_str is an eBPF helper function that safely reads a null-terminated string from user-space memory into an eBPF program which has the prototype long bpf_probe_read_user_str(void *dst, u32 size, const void *unsafe_ptr).
bpf_probe_read_user_str(ev->path, sizeof(ev->path), filename);
This will copy the filename into path member of ev structure. The argv parameter is essentially a double pointer or pointer to a pointer (const char __user *const __user *argv), meaning it points to an array of pointers where each element is a pointer to a string. Hence, we first need to copy the pointer itself (to get the address of the string) and then copy the string data from that address. In our code, we copy up to 7 pointers (defined by #define MAX_ARGS 7) from argv into a temporary storage argp and then extract the strings into the argv member of the ev structure.
for (int i = 0; i < MAX_ARGS; i++) {
const char *argp = NULL;
bpf_probe_read_user(&argp, sizeof(argp), &argv[i]);
if (!argp) {
break;
}
bpf_probe_read_user_str(ev->argv[i], sizeof(ev->argv[i]), argp);
}
We could add the #pragma unroll compiler directive to optimize our loop. Loop unrolling duplicates the loop body multiple times, reducing the overhead of loop control by executing multiple iterations’ work within a single loop iteration. For example,
int sum = 0;
int arr[4] = {1, 2, 3, 4};
#pragma unroll
for (int i = 0; i < 4; i++) {
sum += arr[i];
}
After unrolling:
int sum = 0;
int arr[4] = {1, 2, 3, 4};
sum += arr[0];
sum += arr[1];
sum += arr[2];
sum += arr[3];
Then we submit reserved ring buffer data to make it available in the ring buffer using bpf_ringbuf_submit helper function.
void bpf_ringbuf_submit(void *data, u64 flags) It take a pointer to data as the first argument and flag as the second argument and the flag can be as follow:
* If BPF_RB_NO_WAKEUP is specified in flags, no notification of new data availability is sent.
* If BPF_RB_FORCE_WAKEUP is specified in flags, notification of new data availability is sent unconditionally.
* If 0 is specified in flags, an adaptive notification of new data availability is sent.
bpf_ringbuf_submit(ev, 0);
What really happened is that we first reserved a space inside the ring buffer, then write our data into the reserved space and finally we submit to make these data available in the ring buffer.
#include <stdio.h>
#include <unistd.h>
#include <sys/resource.h>
#include <bpf/libbpf.h>
#include <bpf/bpf.h>
#include "ksyscall.skel.h"
#define MAX_ARGS 7
static int libbpf_print_fn(enum libbpf_print_level level, const char *format, va_list args)
{
return vfprintf(stderr, format, args);
}
struct event {
__u32 pid;
char path[128];
char argv[MAX_ARGS][128];
};
static int handle_event(void *ctx, void *data, size_t data_sz)
{
struct event *e = data;
printf("[execve] PID=%d Path=%s\n", e->pid, e->path);
for (int i = 0; i < MAX_ARGS; i++) {
if (e->argv[i][0] == '\0')
break;
printf(" argv[%d] = %s\n", i, e->argv[i]);
}
printf("\n");
return 0;
}
int main(int argc, char **argv)
{
struct ring_buffer *rb = NULL;
struct ksyscall *skel = NULL;
int err;
libbpf_set_print(libbpf_print_fn);
skel = ksyscall__open();
if (!skel) {
fprintf(stderr, "Failed to open BPF skeleton\n");
return 1;
}
err = ksyscall__load(skel);
if (err) {
fprintf(stderr, "Failed to load BPF skeleton: %d\n", err);
goto cleanup;
}
err = ksyscall__attach(skel);
if (err) {
fprintf(stderr, "Failed to attach BPF skeleton: %d\n", err);
goto cleanup;
}
rb = ring_buffer__new(bpf_map__fd(skel->maps.rb), handle_event, NULL, NULL);
if (!rb) {
fprintf(stderr, "Failed to create ring buffer\n");
err = 1;
goto cleanup;
}
printf("Tracing execve calls... Ctrl+C to exit.\n");
while (1) {
err = ring_buffer__poll(rb, 100);
if (err == -EINTR) {
continue;
} else if (err < 0) {
fprintf(stderr, "Error polling ring buffer: %d\n", err);
break;
}
}
cleanup:
ring_buffer__free(rb);
ksyscall__destroy(skel);
return 0;
}
We Initialize rb to hold the ring buffer.
struct ring_buffer *rb = NULL;
ring_buffer__new takes a file descriptor for BPF_MAP_TYPE_RINGBUF and function to invoke on each each received data.
rb = ring_buffer__new(bpf_map__fd(skel->maps.rb), handle_event, NULL, NULL);
Then we retrieve the newly added data to the ring buffer using ring_buffer__poll function which has the following prototype:int ring_buffer__poll (struct ring_buffer *rb, int timeout_ms).
If Positive timeout_ms: Blocks for the specified time (e.g., 100ms). If data arrives within that time, it processes and returns. If no data arrives, it returns 0.
Iftimeout_ms == 0: Non-blocking. Checks immediately for data. Returns 0 if no data is available.
If Negative timeout_ms: Blocks indefinitely until data becomes available.
Compile the code:
sudo bpftool btf dump file /sys/kernel/btf/vmlinux format c > vmlinux.h
clang -g -O2 -target bpf -c ksyscall_execve.bpf.c -o ksyscall.o
sudo bpftool gen skeleton ksyscall.o > ksyscall.skel.h
clang -o loader loader.c -lbpf
sudo ./loader
Executing any commands will trigger the probe such as ls -l /etc:
Tracing execve calls... Ctrl+C to exit.
[execve] PID=2584 Path=/usr/bin/ls
argv[0] = ls
argv[1] = --color=auto
argv[2] = -l
argv[3] = /etc
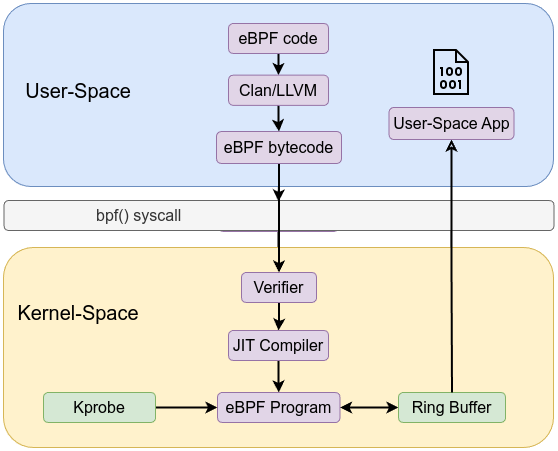
Examining the code using strace sudo strace -ebpf ./loader
[...]
bpf(BPF_MAP_CREATE, {map_type=BPF_MAP_TYPE_RINGBUF, key_size=0, value_size=0, max_entries=65536, map_flags=0, inner_map_fd=0, map_name="rb", map_ifindex=0, btf_fd=5, btf_key_type_id=0, btf_value_type_id=0, btf_vmlinux_value_type_id=0, map_extra=0}, 80) = 6
[...]
bpf(BPF_PROG_LOAD, {prog_type=BPF_PROG_TYPE_KPROBE, insn_cnt=239, insns=0x55f2a2703020, license="GPL", log_level=0, log_size=0, log_buf=NULL, kern_version=KERNEL_VERSION(6, 12, 17), prog_flags=0, prog_name="kprobe_sys_exec", prog_ifindex=0, expected_attach_type=BPF_CGROUP_INET_INGRESS, prog_btf_fd=5, func_info_rec_size=8, func_info=0x55f2a2701810, func_info_cnt=1, line_info_rec_size=16, line_info=0x55f2a2701890, line_info_cnt=115, attach_btf_id=0, attach_prog_fd=0, fd_array=NULL}, 148) = 6
[...]
Shows the program type is indeed BPF_PROG_TYPE_KPROBE and it uses the map type of BPF_MAP_TYPE_RINGBUF.
A similar approach can be used with the kretsyscall with BPF_KRETPROBE macro to capture a syscall’s return value. The following probe will be triggered when execve syscall returns:
define __TARGET_ARCH_x86
#include "vmlinux.h"
#include <bpf/bpf_helpers.h>
#include <bpf/bpf_tracing.h>
#include <bpf/bpf_core_read.h>
char LICENSE[] SEC("license") = "GPL";
SEC("kretsyscall/execve")
int BPF_KRETPROBE(kretprobe_sys_execve, int ret)
{
pid_t pid = bpf_get_current_pid_tgid() >> 32;
bpf_printk("Execve return :pid = %d ret = %d\n", pid , ret);
return 0;
}
<...>-1781 [...] bpf_trace_printk: Execve return :pid = 1781 ret = 0
<...>-1782 [...] bpf_trace_printk: Execve return :pid = 1782 ret = 0
<...>-1847 [...] bpf_trace_printk: Execve return :pid = 1847 ret = -2
Uprobes and uretprobes enable instrumentation of user-space applications in a manner similar to how kprobes and kretprobes instrument kernel functions. Instead of tracing kernel-level routines, uprobes and uretprobes attach to functions (or instructions) within user-space executables and shared libraries. This allows system-wide dynamic instrumentation of user applications, including libraries that are shared among many processes.
Unlike the kprobe interface—where the kernel knows the symbol addresses of kernel functions—uprobes require the user to specify the file path and offset of the instruction(s) or function(s) to probe. The offset is calculated from the start of the executable or library file. Once attached, any process using that binary (including those that start in the future) is instrumented.
A uprobe is placed at a specific instruction in a user-space binary (e.g., a function’s entry point in an application or library). When that instruction executes, the CPU hits a breakpoint, and control is transferred to the kernel’s uprobes framework, which then calls the attached eBPF handler. This handler can inspect arguments (readable from user-space memory), task metadata, and more. uprobe eBPF programs are classified under the program type BPF_PROG_TYPE_KPROBE.
bpf_probe_read_user() or related helpers. After the handler completes, uprobes single-step the replaced instruction and return execution control to user space.Before uprobe:
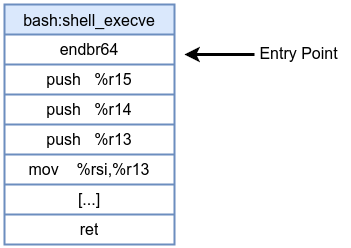
After uprobe insertion:
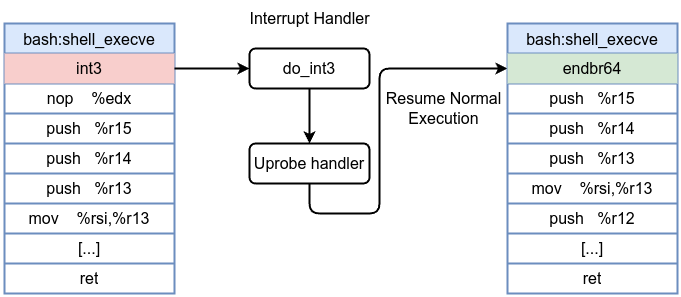
We can get list of all symbols from object or binary files using nm or objdump, for example, to get list of all symbols from /bin/bash all we have to do is nm -D /bin/bash to get dynamic symbols because /bin/bash is stripped of debug symbols, so if you use nm /bin/bash you will get nm: /bin/bash: no symbols.
objdump can extract dynamic symbols using objdump -T /bin/bash. That’s how the output looks in case of nm
[...]
0000000000136828 D shell_builtins
0000000000135cf8 D shell_compatibility_level
000000000013d938 B shell_environment
000000000013da90 B shell_eof_token
0000000000048930 T shell_execve
0000000000131b40 D shell_flags
000000000013f270 B shell_function_defs
000000000013f280 B shell_functions
00000000000839e0 T shell_glob_filename
000000000013d97c B shell_initialized
0000000000032110 T shell_is_restricted
[...]
D or data symbols which represent initialized variable, while B or BSS symbols represent uninitialized global variables and T or text symbols represent code which we are interested in. Let’s attach uprobe to entry point of shell_execve function. shell_execve has a prototype of int shell_execve(char *filename, char **argv, char **envp); which is similar to execve syscall man 2 execve which has this prototype
int execve(const char *pathname, char *const _Nullable argv[],
char *const _Nullable envp[]);
pathname must be either a binary executable, or a script starting with a line of the form:
#!interpreter [optional-arg]
argv is an array of pointers to strings passed to the new program as its command-line ar‐
guments. By convention, the first of these strings (i.e., argv[0]) should contain the
filename associated with the file being executed. The argv array must be terminated by a
null pointer. (Thus, in the new program, argv[argc] will be a null pointer.)
envp is an array of pointers to strings, conventionally of the form key=value, which are
passed as the environment of the new program. The envp array must be terminated by a null
pointer.
Starting with attache uprobe to /bin/bash:shell_execve and extract which command is being executed along with PID and send events to the user-space via ring buffer.
#define __TARGET_ARCH_x86
#include "vmlinux.h"
#include <bpf/bpf_helpers.h>
#include <bpf/bpf_tracing.h>
struct event {
pid_t pid;
char command[32];
};
struct {
__uint(type, BPF_MAP_TYPE_RINGBUF);
__uint(max_entries, 4096);
} events SEC(".maps");
char LICENSE[] SEC("license") = "GPL";
SEC("uprobe//bin/bash:shell_execve")
int BPF_UPROBE(uprobe_bash_shell_execve, const char *filename)
{
struct event *evt;
evt = bpf_ringbuf_reserve(&events, sizeof(struct event), 0);
if (!evt)
return 0;
evt->pid = bpf_get_current_pid_tgid() >> 32;
bpf_probe_read_user_str(evt->command, sizeof(evt->command), filename);
bpf_ringbuf_submit(evt, 0);
return 0;
}
We defined a ring buffer type of map with name events
struct {
__uint(type, BPF_MAP_TYPE_RINGBUF);
__uint(max_entries, 4096);
} events SEC(".maps");
Then we used BPF_UPROBE macro which is exactly like BPF_KPROBE which takes the first argument as a name for the function followed by any additional arguments you want to capture.
int BPF_UPROBE(uprobe_bash_shell_execve, const char *filename)
Then reserve space in eBPF ring buffer using bpf_ringbuf_reserve helper function.
evt = bpf_ringbuf_reserve(&events, sizeof(struct event), 0);
Then we copy filename into command member in evt structure.
bpf_probe_read_user_str(evt->command, sizeof(evt->command), filename);
Then we submit evt structure.
bpf_ringbuf_submit(evt, 0);
The user-space code is similar to the one we did before in ksyscall.
#include <stdio.h>
#include <unistd.h>
#include <sys/resource.h>
#include <bpf/libbpf.h>
#include <bpf/bpf.h>
#include "uprobe.skel.h"
static int libbpf_print_fn(enum libbpf_print_level level, const char *format, va_list args)
{
return vfprintf(stderr, format, args);
}
struct event {
pid_t pid;
char command[32];
};
static int handle_event(void *ctx, void *data, size_t data_sz)
{
struct event *evt = (struct event *)data;
printf("Process ID: %d, Command: %s\n", evt->pid, evt->command);
return 0;
}
int main(int argc, char **argv)
{
struct uprobe *skel;
struct ring_buffer *rb = NULL;
int err;
libbpf_set_print(libbpf_print_fn);
skel = uprobe__open();
if (!skel) {
fprintf(stderr, "Failed to open BPF skeleton\n");
return 1;
}
err = uprobe__load(skel);
if (err) {
fprintf(stderr, "Failed to load and verify BPF skeleton\n");
goto cleanup;
}
err = uprobe__attach(skel);
if (err) {
fprintf(stderr, "Failed to attach BPF skeleton\n");
goto cleanup;
}
rb = ring_buffer__new(bpf_map__fd(skel->maps.events), handle_event, NULL, NULL);
if (!rb) {
fprintf(stderr, "Failed to create ring buffer\n");
goto cleanup;
}
printf("Successfully started! Listening for events...\n");
while (1) {
err = ring_buffer__poll(rb, 100);
if (err < 0) {
fprintf(stderr, "Error polling ring buffer\n");
break;
}
}
cleanup:
ring_buffer__free(rb);
uprobe__destroy(skel);
return -err;
}
Let’s compile both codes and run the code
sudo bpftool btf dump file /sys/kernel/btf/vmlinux format c > vmlinux.h
clang -g -O2 -target bpf -c uprobe-shell_execve.bpf.c -o uprobe.o
sudo bpftool gen skeleton uprobe.o > uprobe.skel.h
clang -o loader loader.c -lbpf
sudo ./loader
Open a new terminal and execute bash & then gdb -p PID in my case gdb -p 1923 then disassemble shell_execve and you will get something similar
(gdb) disassemble shell_execve
Dump of assembler code for function shell_execve:
0x00005601e928c930 <+0>: int3
0x00005601e928c931 <+1>: nop %edx
0x00005601e928c934 <+4>: push %r15
0x00005601e928c936 <+6>: push %r14
0x00005601e928c938 <+8>: push %r13
0x00005601e928c93a <+10>: mov %rsi,%r13
0x00005601e928c93d <+13>: push %r12
0x00005601e928c93f <+15>: push %rbp
0x00005601e928c940 <+16>: push %rbx
0x00005601e928c941 <+17>: mov %rdi,%rbx
0x00005601e928c944 <+20>: sub $0xa8,%rsp
0x00005601e928c94b <+27>: mov %fs:0x28,%r14
[...]
Notice int3 at the entry point of shell_execve which is a software breakpoint set by uprobe. You will get also something similar on the loader terminal
libbpf: sec 'uprobe//bin/bash:shell_execve': found 1 CO-RE relocations
libbpf: CO-RE relocating [10] struct pt_regs: found target candidate [136] struct pt_regs in [vmlinux]
libbpf: prog 'uprobe_bash_shell_execve': relo #0: <byte_off> [10] struct pt_regs.di (0:14 @ offset 112)
libbpf: prog 'uprobe_bash_shell_execve': relo #0: matching candidate #0 <byte_off> [136] struct pt_regs.di (0:14 @ offset 112)
libbpf: prog 'uprobe_bash_shell_execve': relo #0: patched insn #0 (LDX/ST/STX) off 112 -> 112
libbpf: map 'events': created successfully, fd=3
libbpf: elf: symbol address match for 'shell_execve' in '/bin/bash': 0x48930
Successfully started! Listening for events...
Process ID: 1923, Command: /usr/bin/bash
Process ID: 1924, Command: /usr/bin/gdb
Running it with strace sudo strace -ebpf ./loader to capture bpf() syscalls shows that the the prog_type is indeed BPF_PROG_TYPE_KPROBE and the prog_name is uprobe_bash_shell_execve and map_type is BPF_MAP_TYPE_RINGBUF.
bpf(BPF_MAP_CREATE, {map_type=BPF_MAP_TYPE_RINGBUF, key_size=0, value_size=0, max_entries=4096, map_flags=0, inner_map_fd=0, map_name="events", map_ifindex=0, btf_fd=4, btf_key_type_id=0, btf_value_type_id=0, btf_vmlinux_value_type_id=0, map_extra=0}, 80) = 5
bpf(BPF_PROG_LOAD, {prog_type=BPF_PROG_TYPE_KPROBE, insn_cnt=21, insns=0x55adbd3b0000, license="GPL", log_level=0, log_size=0, log_buf=NULL, kern_version=KERNEL_VERSION(6, 12, 12), prog_flags=0, prog_name="uprobe_bash_shell_execve", prog_ifindex=0, expected_attach_type=BPF_CGROUP_INET_INGRESS, prog_btf_fd=4, func_info_rec_size=8, func_info=0x55adbd3ae7e0, func_info_cnt=1, line_info_rec_size=16, line_info=0x55adbd3ae860, line_info_cnt=10, attach_btf_id=0, attach_prog_fd=0, fd_array=NULL}, 148) = 5
At this point i hope you got that you can uprobe your own code. Compile this code as /tmp/test and compile it gcc -g test.c -o test
#include <stdio.h>
const char* get_message() {
return "got uprobed!!";
}
int main() {
const char* message = get_message();
printf("%s\n", message);
return 0;
}
With eBPF code
#define __TARGET_ARCH_x86
#include "vmlinux.h"
#include <bpf/bpf_helpers.h>
#include <bpf/bpf_tracing.h>
char LICENSE[] SEC("license") = "GPL";
SEC("uprobe//tmp/test:get_message")
int BPF_UPROBE(trace_my_function)
{
pid_t pid;
pid = bpf_get_current_pid_tgid() >> 32;
bpf_printk("PID %d \n", pid);
return 0;
}
Then you will get
exam-3142 [003] ...11 17712.082503: bpf_trace_printk: PID 3142
A uretprobe triggers when a user-space function returns. Just like kretprobes, uretprobes replace the function’s return address with a trampoline so that when the function completes, execution hits the trampoline first—invoking the eBPF return handler before returning to the actual caller. uprobe eBPF programs are also classified under the program type BPF_PROG_TYPE_KPROBE.
Before uretprobe:

After uretprobe installation:
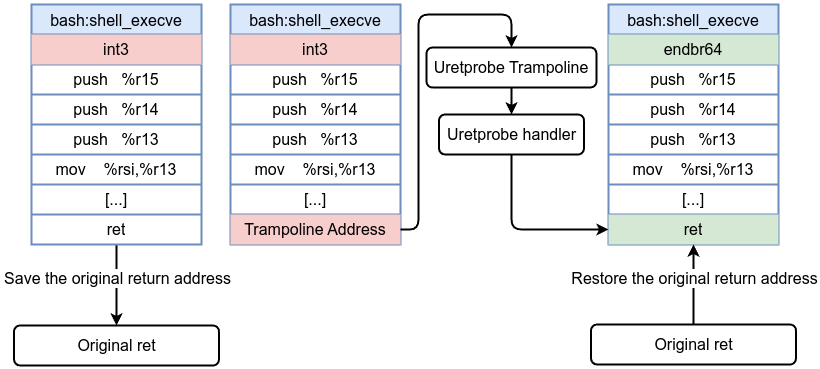
The readline function in bash reads the user’s input from the terminal and returns a pointer to the string containing the text of the line read. Its prototype is:
char *readline (const char *prompt);. You can use eBPF to capture or record the user input in bash by hooking into the return of the readline function.
#define __TARGET_ARCH_x86
#include "vmlinux.h"
#include <bpf/bpf_helpers.h>
#include <bpf/bpf_tracing.h>
struct event {
pid_t pid;
char command[64];
};
struct {
__uint(type, BPF_MAP_TYPE_RINGBUF);
__uint(max_entries, 2048);
} events SEC(".maps");
char LICENSE[] SEC("license") = "GPL";
SEC("uretprobe//bin/bash:readline")
int BPF_URETPROBE(uretprobe_readline, const void *ret)
{
struct event *evt;
evt = bpf_ringbuf_reserve(&events, sizeof(struct event), 0);
if (!evt)
return 0;
evt->pid = bpf_get_current_pid_tgid() >> 32;
bpf_probe_read_user_str(evt->command, sizeof(evt->command), ret);
bpf_ringbuf_submit(evt, 0);
return 0;
};
Successfully started! Listening for events...
Process ID: 1859, Command: cat /etc/passwd
Process ID: 1859, Command: cat /etc/issue.net
Process ID: 1859, Command: ls -l
Let’s walk through some advanced examples: we will demonstrate how to capture the password entered in PAM and how to observe decrypted traffic without needing CA certificates, all using uprobes.
PAM (Pluggable Authentication Modules) is a framework that offers a modular approach to authentication, making it easier to manage and secure the login process. During authentication, the pam_get_user function is responsible for obtaining the username from the session, while pam_get_authtok retrieves the corresponding password or token, ensuring that each step is handled securely and flexibly.
The function prototype for pam_get_authtok is:
int pam_get_authtok(pam_handle_t *pamh, int item,
const char **authtok, const char *prompt);
According to the man page, this function returns the cached authentication token (for example, a password) if one is available, or it prompts the user to enter one if no token is cached. Upon successful return, the **authtok parameter will point to the value of the authentication token. This function is intended for internal use by Linux-PAM and PAM service modules.
The prototype for pam_get_user is:
int pam_get_user(const pam_handle_t *pamh, const char **user, const char *prompt);
The pam_get_user function returns the name of the user specified by the pam_start function, which is responsible for creating the PAM context and initiating the PAM transaction. A pointer to the username is then returned as the contents of *user.
**authtok in pam_get_authtok and **user in pam_get_user are pointers to pointers.
To capture the password, we need to attach uprobe to libpam /lib/x86_64-linux-gnu/libpam.so.0:pam_get_authtok at the entry point and exit point, why entry point and exit point, short answer is that in pam_get_authtok the password pointer (**authtok) isn’t fully assigned or valid at the start of the function. Instead, the function fills in that pointer somewhere inside (for example, prompting the user or retrieving from memory), so by the time the function returns, the pointer (and thus the password string) is set. Hence, a uretprobe (return probe) is the only reliable place to grab the final pointer to the password.
The same goes for capturing the user, we need to attach uprobe to libpam /lib/x86_64-linux-gnu/libpam.so.0:pam_get_user at the entry point and exit point.
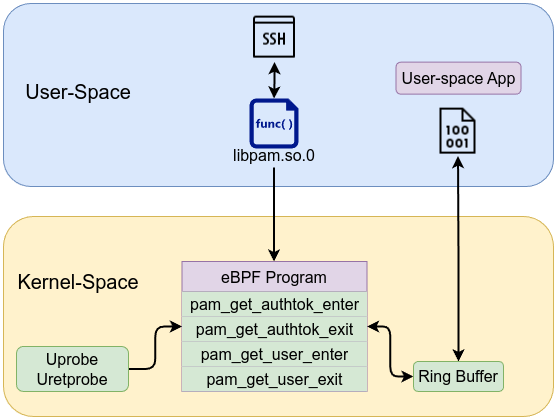
#define __TARGET_ARCH_x86
#include "vmlinux.h"
#include <bpf/bpf_helpers.h>
#include <bpf/bpf_tracing.h>
#include <bpf/bpf_core_read.h>
#define MAX_PW_LEN 128
#define MAX_USER_LEN 64
char LICENSE[] SEC("license") = "GPL";
struct event {
int pid;
char comm[16];
char password[MAX_PW_LEN];
char username[MAX_USER_LEN];
};
struct {
__uint(type, BPF_MAP_TYPE_RINGBUF);
__uint(max_entries, 4096);
} events SEC(".maps");
struct {
__uint(type, BPF_MAP_TYPE_HASH);
__uint(max_entries, 1024);
__type(key, __u32);
__type(value, __u64);
} authtok_ptrs SEC(".maps");
struct {
__uint(type, BPF_MAP_TYPE_HASH);
__uint(max_entries, 1024);
__type(key, __u32);
__type(value, __u64);
} user_ptrs SEC(".maps");
SEC("uprobe//lib/x86_64-linux-gnu/libpam.so.0:pam_get_authtok")
int BPF_UPROBE(pam_get_authtok_enter,
void *pamh,
int item,
const char **authtok,
const char *prompt)
{
pid_t pid = bpf_get_current_pid_tgid() >> 32;
__u64 atok_ptr = (unsigned long)authtok;
bpf_map_update_elem(&authtok_ptrs, &pid, &atok_ptr, BPF_ANY);
return 0;
}
SEC("uretprobe//lib/x86_64-linux-gnu/libpam.so.0:pam_get_authtok")
int BPF_URETPROBE(pam_get_authtok_exit)
{
pid_t pid = bpf_get_current_pid_tgid() >> 32;
int ret = PT_REGS_RC(ctx);
__u64 *stored = bpf_map_lookup_elem(&authtok_ptrs, &pid);
if (!stored)
return 0;
bpf_map_delete_elem(&authtok_ptrs, &pid);
if (ret != 0)
return 0;
__u64 atok_addr = 0;
bpf_probe_read_user(&atok_addr, sizeof(atok_addr), (const void *)(*stored));
if (!atok_addr)
return 0;
struct event *evt = bpf_ringbuf_reserve(&events, sizeof(struct event), 0);
if (!evt)
return 0;
evt->pid = pid;
bpf_get_current_comm(&evt->comm, sizeof(evt->comm));
bpf_probe_read_user(evt->password, sizeof(evt->password), (const void *)atok_addr);
bpf_ringbuf_submit(evt, 0);
return 0;
}
SEC("uprobe//lib/x86_64-linux-gnu/libpam.so.0:pam_get_user")
int BPF_UPROBE(pam_get_user_enter,
void *pamh,
const char **user,
const char *prompt)
{
pid_t pid = bpf_get_current_pid_tgid() >> 32;
__u64 user_ptr = (unsigned long)user;
bpf_map_update_elem(&user_ptrs, &pid, &user_ptr, BPF_ANY);
return 0;
}
SEC("uretprobe//lib/x86_64-linux-gnu/libpam.so.0:pam_get_user")
int BPF_URETPROBE(pam_get_user_exit)
{
pid_t pid = bpf_get_current_pid_tgid() >> 32;
int ret = PT_REGS_RC(ctx);
__u64 *stored = bpf_map_lookup_elem(&user_ptrs, &pid);
if (!stored)
return 0;
bpf_map_delete_elem(&user_ptrs, &pid);
if (ret != 0)
return 0;
__u64 user_addr = 0;
bpf_probe_read_user(&user_addr, sizeof(user_addr), (const void *)(*stored));
if (!user_addr)
return 0;
struct event *evt = bpf_ringbuf_reserve(&events, sizeof(struct event), 0);
if (!evt)
return 0;
evt->pid = pid;
bpf_get_current_comm(&evt->comm, sizeof(evt->comm));
bpf_probe_read_user(evt->username, sizeof(evt->username), (const void *)user_addr);
bpf_ringbuf_submit(evt, 0);
return 0;
}
First, we defined struct event and then created two BPF_MAP_TYPE_HASH maps to process and hold the username and password passed by the functions. Since **authtok and **user are pointers to pointers, we need to call bpf_probe_read_user twice to correctly read the values.
#include <stdio.h>
#include <stdlib.h>
#include <unistd.h>
#include <errno.h>
#include <signal.h>
#include <stdarg.h>
#include <bpf/libbpf.h>
#include <bpf/bpf.h>
#include "pamcapture.skel.h"
#define MAX_PW_LEN 128
struct event {
int pid;
char comm[16];
char password[MAX_PW_LEN];
char username[64];
};
static int handle_event(void *ctx, void *data, size_t data_sz)
{
struct event *evt = data;
printf("\n---- PAM Password capture ----\n");
if (evt->username[0] == '\0') {
printf("\n---- PAM Password captured ----\n");
printf("PID: %d, COMM: %.*s, Password: %s\n", evt->pid, 16, evt->comm, evt->password);
} else {
printf("\n---- PAM Uusername capture ----\n");
printf("PID: %d, username = %s\n", evt->pid,evt->username);
}
return 0;
}
static int libbpf_print_fn(enum libbpf_print_level level, const char *format, va_list args)
{
return vfprintf(stderr, format, args);
}
int main(int argc, char **argv)
{
struct pamcapture *skel = NULL;
struct ring_buffer *rb = NULL;
int err;
libbpf_set_print(libbpf_print_fn);
skel = pamcapture__open();
if (!skel) {
fprintf(stderr, "Failed to open BPF skeleton\n");
return 1;
}
err = pamcapture__load(skel);
if (err) {
fprintf(stderr, "Failed to load and verify BPF skeleton\n");
goto cleanup;
}
err = pamcapture__attach(skel);
if (err) {
fprintf(stderr, "Failed to attach BPF skeleton\n");
goto cleanup;
}
rb = ring_buffer__new(bpf_map__fd(skel->maps.events), handle_event, NULL, NULL);
if (!rb) {
fprintf(stderr, "Failed to create ring buffer\n");
goto cleanup;
}
printf("PAM password capture attached! Press Ctrl-C to exit.\n");
while (1) {
err = ring_buffer__poll(rb, 100);
if (err < 0) {
fprintf(stderr, "Error polling ring buffer\n");
break;
}
}
cleanup:
ring_buffer__free(rb);
pamcapture__destroy(skel);
return err < 0 ? -err : 0;
}
The output should be similar to the following
PAM password capture attached! Press Ctrl-C to exit.
---- PAM Uusername capture ----
PID: 2663, username = test
---- PAM Password captured ----
PID: 2663, COMM: sshd-session, Password: admin
Let’s explore another example to show you the power of uprobe/uretprobe. Libssl is a core component of the OpenSSL library, providing implementations of the Secure Sockets Layer (SSL) and Transport Layer Security (TLS) protocols to enable secure communications over network by encrypting data. You can check the list of all functions by executing command like nm on /lib/x86_64-linux-gnu/libssl.so.3 or whatever libssl version you have. Couple of its core functions are SSL_read and SSL_write. SSL_read reads data from an SSL/TLS connection, decrypting it and storing the result in the buffer pointed to by buf. Here, buf is a pointer to user-space memory where the decrypted data is written. SSL_read has a prototype of:
int SSL_read(SSL *ssl, void *buf, int num);
SSL_write function writes data to an SSL/TLS connection by encrypting the content of the buffer pointed to by buf and transmitting it. In this case, buf is a pointer to the user-space memory containing the plaintext data that will be encrypted. SSL_write has a prototype of:
int SSL_write(SSL *ssl, const void *buf, int num);
Uprobes let you intercept user-space function calls at runtime. By attaching them to libssl’s SSL_read and SSL_write, you capture data after it’s decrypted (or before it’s encrypted) inside the process memory. This means you get the plaintext data directly, without needing to use a CA to decrypt network traffic.
To capture decrypted traffic for both ways (send and receive ), we need to attach uprobe at the entry point and the exit point for each function. You need to attach a probe at the entry point to capture the buffer pointer (the address of buf) as soon as the function is called, because that pointer is passed as an argument. Then, attaching a probe at the exit point lets you read the final data from that buffer after the function has processed it.
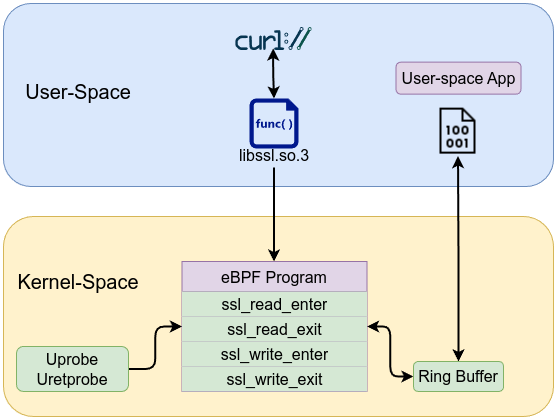
The curl command on my ubuntu box is version 8.5.0 which still uses libssl
curl -V
curl 8.5.0 (x86_64-pc-linux-gnu) libcurl/8.5.0 OpenSSL/3.0.13 zlib/1.3 brotli/1.1.0 zstd/1.5.5 libidn2/2.3.7 libpsl/0.21.2 (+libidn2/2.3.7) libssh/0.10.6/openssl/zlib nghttp2/1.59.0 librtmp/2.3 OpenLDAP/2.6.7
[...]
ldd /usr/bin/curl
[...]
libssl.so.3 => /lib/x86_64-linux-gnu/libssl.so.3 (0x00007a1b58443000)
[...]
Let’s see the kernel code:
#define __TARGET_ARCH_x86
#include "vmlinux.h"
#include <bpf/bpf_helpers.h>
#include <bpf/bpf_tracing.h>
#include <bpf/bpf_core_read.h>
#define MAX_BUF_SIZE 4096
char LICENSE[] SEC("license") = "GPL";
enum STATE {
STATE_READ = 0,
STATE_WRITE = 1,
};
struct data {
enum STATE STATE;
int len;
char comm[16];
char buf[MAX_BUF_SIZE];
};
struct {
__uint(type, BPF_MAP_TYPE_RINGBUF);
__uint(max_entries, 1 << 24);
} events SEC(".maps");
struct {
__uint(type, BPF_MAP_TYPE_HASH);
__uint(max_entries, 1024);
__type(key, __u32);
__type(value, __u64);
} buffers SEC(".maps");
static __always_inline __u32 get_tgid(void)
{
return (__u32)bpf_get_current_pid_tgid();
}
static int ssl_exit(struct pt_regs *ctx, enum STATE STATE)
{
__u32 tgid = get_tgid();
int ret = PT_REGS_RC(ctx);
if (ret <= 0) {
bpf_map_delete_elem(&buffers, &tgid);
return 0;
}
__u64 *bufp = bpf_map_lookup_elem(&buffers, &tgid);
if (!bufp) {
return 0;
}
if (*bufp == 0) {
bpf_map_delete_elem(&buffers, &tgid);
return 0;
}
struct data *data = bpf_ringbuf_reserve(&events, sizeof(*data), 0);
if (!data)
return 0;
data->STATE = STATE;
data->len = ret;
bpf_get_current_comm(&data->comm, sizeof(data->comm));
int err = bpf_probe_read_user(data->buf, sizeof(data->buf), (void *)(*bufp));
if (err) {
bpf_map_delete_elem(&buffers, &tgid);
bpf_ringbuf_submit(data, 0);
return 0;
}
bpf_map_delete_elem(&buffers, &tgid);
bpf_ringbuf_submit(data, 0);
return 0;
}
SEC("uprobe//lib/x86_64-linux-gnu/libssl.so.3:SSL_read")
int BPF_UPROBE(ssl_read_enter, void *ssl, void *buf, int num)
{
__u32 tgid = get_tgid();
bpf_map_update_elem(&buffers, &tgid, &buf, BPF_ANY);
return 0;
}
SEC("uretprobe//lib/x86_64-linux-gnu/libssl.so.3:SSL_read")
int BPF_URETPROBE(ssl_read_exit)
{
return ssl_exit(ctx, STATE_READ);
}
SEC("uprobe//lib/x86_64-linux-gnu/libssl.so.3:SSL_write")
int BPF_UPROBE(ssl_write_enter, void *ssl, const void *buf, int num)
{
__u32 tgid = get_tgid();
bpf_map_update_elem(&buffers, &tgid, &buf, BPF_ANY);
return 0;
}
SEC("uretprobe//lib/x86_64-linux-gnu/libssl.so.3:SSL_write")
int BPF_URETPROBE(ssl_write_exit)
{
return ssl_exit(ctx, STATE_WRITE);
}
The ssl_exit function retrieves the return value to determine if any data was processed and then uses the process ID (tgid) to look up the previously stored user-space buffer pointer. The function then reserves an event structure from the ring buffer, reads the actual data from user memory using bpf_probe_read_user, and finally submits the event while cleaning up the stored pointer from the BPF hash map.
__always_inline macros is used to tell the compiler to inline a function.This means that rather than generating a normal function call, the compiler inserts the body of the function directly into the calling code.
The user-space code:
#include <stdio.h>
#include <stdlib.h>
#include <unistd.h>
#include <sys/resource.h>
#include <bpf/libbpf.h>
#include <bpf/bpf.h>
#include "sslsniff.skel.h"
#define MAX_BUF_SIZE 4096
enum STATE {
STATE_READ = 0,
STATE_WRITE = 1,
};
struct data {
enum STATE STATE;
int len;
char comm[16];
char buf[MAX_BUF_SIZE];
};
static int libbpf_print_fn(enum libbpf_print_level level, const char *format, va_list args)
{
return vfprintf(stderr, format, args);
}
static int handle_event(void *ctx, void *data, size_t data_sz)
{
struct data *evt = data;
int data_len = evt->len < MAX_BUF_SIZE ? evt->len : MAX_BUF_SIZE;
const char *dir_str = (evt->STATE == STATE_WRITE) ? "SEND" : "RECV";
printf("\n--- Perf Event ---\n");
printf("Process: %s, Type: %d, Bytes: %d\n", evt->comm, dir_str, evt->len);
printf("Data (first %d bytes):\n", data_len);
fwrite(evt->buf, 1, data_len, stdout);
return 0;
}
int main(int argc, char **argv)
{
struct sslsniff *skel = NULL;
struct ring_buffer *rb = NULL;
int err;
libbpf_set_print(libbpf_print_fn);
skel = sslsniff__open();
if (!skel) {
fprintf(stderr, "Failed to open BPF skeleton\n");
return 1;
}
err = sslsniff__load(skel);
if (err) {
fprintf(stderr, "Failed to load and verify BPF skeleton\n");
goto cleanup;
}
err = sslsniff__attach(skel);
if (err) {
fprintf(stderr, "Failed to attach BPF skeleton\n");
goto cleanup;
}
rb = ring_buffer__new(bpf_map__fd(skel->maps.events), handle_event, NULL, NULL);
if (!rb) {
fprintf(stderr, "Failed to create ring buffer\n");
goto cleanup;
}
printf("libssl sniffer attached. Press Ctrl+C to exit.\n");
while (1) {
err = ring_buffer__poll(rb, 100);
if (err < 0) {
fprintf(stderr, "Error polling ring buffer\n");
break;
}
}
cleanup:
ring_buffer__free(rb);
sslsniff__destroy(skel);
return err < 0 ? -err : 0;
}
Running curl command curl https://www.hamza-megahed.com/robots.txt --http1.1 and we will get a similar traffic to the following:
--- Perf Event ---
Process: curl, Type: SEND, Bytes: 94
Data (first 94 bytes):
GET /robots.txt HTTP/1.1
Host: www.hamza-megahed.com
User-Agent: curl/8.5.0
Accept: */*
--- Perf Event ---
Process: curl, Type: RECV, Bytes: 1172
Data (first 1172 bytes):
HTTP/1.1 200 OK
Date: Sun, 02 Mar 2025 20:57:27 GMT
Content-Type: text/plain
Content-Length: 66
[...]
User-agent: *
Sitemap: https://www.hamza-megahed.com/sitemap.xml
As you can see, the traffic is decrypted!
Now let’s do the same to GnuTLS which has two functions gnutls_record_recv and gnutls_record_send
GnuTLS is a secure communications library that implements TLS/SSL protocols. Two core functions in this library are: gnutls_record_recv with prototype:
ssize_t gnutls_record_recv(gnutls_session_t session, void *data, size_t data_size);
gnutls_record_recv function receives an encrypted record from a GnuTLS session, decrypts it, and writes the resulting plaintext into the user-provided buffer pointed to by data.
Function gnutls_record_send with prototype
ssize_t gnutls_record_send(gnutls_session_t session, const void *data, size_t data_size);
gnutls_record_send function takes plaintext data from the user-provided buffer pointed to by data, encrypts it, and sends it over the network as an encrypted record.
I have another box with curl version 8.12.1
curl 8.12.1 (x86_64-pc-linux-gnu) libcurl/8.12.1 GnuTLS/3.8.9 zlib/1.3.1 brotli/1.1.0 zstd/1.5.6 libidn2/2.3.7 libpsl/0.21.2 libssh2/1.11.1 nghttp2/1.64.0 ngtcp2/1.9.1 nghttp3/1.6.0 librtmp/2.3 OpenLDAP/2.6.9
Release-Date: 2025-02-13, security patched: 8.12.1-2
The location of libgnutls linked to curl command can be obtained by running ldd /usr/bin/curl
libgnutls.so.30 => /lib/x86_64-linux-gnu/libgnutls.so.30 (0x00007f82da200000)
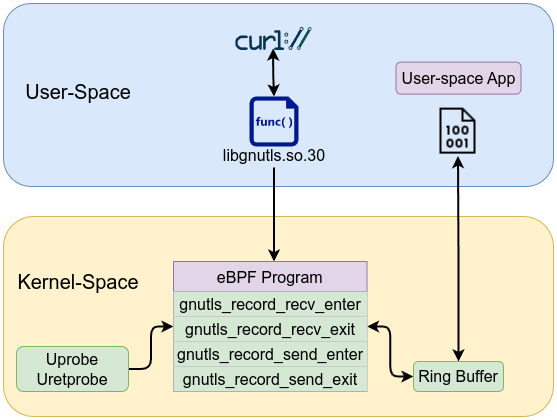
To capture the decrypted or plaintext data processed by these functions, you need to attach uprobes at both the entry and exit points of each function. Attaching a probe at the entry captures the buffer pointer as it is passed to the function, while attaching a probe at the exit allows you to read the final processed data from that buffer once the function has completed its work.
#define __TARGET_ARCH_x86
#include "vmlinux.h"
#include <bpf/bpf_helpers.h>
#include <bpf/bpf_tracing.h>
#include <bpf/bpf_core_read.h>
#define MAX_BUF_SIZE 4096
char LICENSE[] SEC("license") = "GPL";
enum STATE {
STATE_READ = 0,
STATE_WRITE = 1,
};
struct data {
enum STATE STATE;
int len;
char comm[16];
char buf[MAX_BUF_SIZE];
};
struct {
__uint(type, BPF_MAP_TYPE_RINGBUF);
__uint(max_entries, 1 << 24);
} events SEC(".maps");
struct {
__uint(type, BPF_MAP_TYPE_HASH);
__uint(max_entries, 1024);
__type(key, __u32);
__type(value, __u64);
} buffers SEC(".maps");
static __always_inline __u32 get_tgid(void)
{
return (__u32)bpf_get_current_pid_tgid();
}
static int record_exit(struct pt_regs *ctx, enum STATE STATE)
{
__u32 tgid = get_tgid();
int ret = PT_REGS_RC(ctx);
if (ret <= 0) {
bpf_map_delete_elem(&buffers, &tgid);
return 0;
}
__u64 *bufp = bpf_map_lookup_elem(&buffers, &tgid);
if (!bufp) {
return 0;
}
if (*bufp == 0) {
bpf_map_delete_elem(&buffers, &tgid);
return 0;
}
struct data *data = bpf_ringbuf_reserve(&events, sizeof(*data), 0);
if (!data)
return 0;
data->STATE = STATE;
data->len = ret;
bpf_get_current_comm(&data->comm, sizeof(data->comm));
int err = bpf_probe_read_user(data->buf, sizeof(data->buf), (void *)(*bufp));
if (err) {
bpf_map_delete_elem(&buffers, &tgid);
bpf_ringbuf_submit(data, 0);
return 0;
}
bpf_map_delete_elem(&buffers, &tgid);
bpf_ringbuf_submit(data, 0);
return 0;
}
SEC("uprobe//lib/x86_64-linux-gnu/libgnutls.so.30:gnutls_record_recv")
int BPF_UPROBE(gnutls_record_recv_enter, void *session, void *data, size_t sizeofdata)
{
__u32 tgid = get_tgid();
bpf_map_update_elem(&buffers, &tgid, &data, BPF_ANY);
return 0;
}
SEC("uretprobe//lib/x86_64-linux-gnu/libgnutls.so.30:gnutls_record_recv")
int BPF_URETPROBE(gnutls_record_recv_exit)
{
return record_exit(ctx, STATE_READ);
}
SEC("uprobe//lib/x86_64-linux-gnu/libgnutls.so.30:gnutls_record_send")
int BPF_UPROBE(gnutls_record_send_enter, void *session, const void *data, size_t sizeofdata)
{
__u32 tgid = get_tgid();
bpf_map_update_elem(&buffers, &tgid, &data, BPF_ANY);
return 0;
}
SEC("uretprobe//lib/x86_64-linux-gnu/libgnutls.so.30:gnutls_record_send")
int BPF_URETPROBE(gnutls_record_send_exit)
{
return record_exit(ctx, STATE_WRITE);
}
The user-space code:
#include <stdio.h>
#include <stdlib.h>
#include <unistd.h>
#include <sys/resource.h>
#include <bpf/libbpf.h>
#include <bpf/bpf.h>
#include "gnutls_sniffer.skel.h"
#define MAX_BUF_SIZE 4096
enum STATE {
STATE_READ = 0,
STATE_WRITE = 1,
};
struct data {
enum STATE STATE;
int len;
char comm[16];
char buf[MAX_BUF_SIZE];
};
static int libbpf_print_fn(enum libbpf_print_level level, const char *format, va_list args)
{
return vfprintf(stderr, format, args);
}
static int handle_event(void *ctx, void *data, size_t data_sz)
{
struct data *evt = data;
int data_len = evt->len < MAX_BUF_SIZE ? evt->len : MAX_BUF_SIZE;
const char *dir_str = (evt->STATE == STATE_WRITE) ? "SEND" : "RECV";
printf("\n--- Perf Event ---\n");
printf("Process: %s, Type: %s, Bytes: %d\n", evt->comm, dir_str, evt->len);
printf("Data (first %d bytes):\n", data_len);
fwrite(evt->buf, 1, data_len, stdout);
return 0;
}
int main(int argc, char **argv)
{
struct gnutls_sniffer *skel = NULL;
struct ring_buffer *rb = NULL;
int err;
skel = gnutls_sniffer__open();
if (!skel) {
fprintf(stderr, "Failed to open BPF skeleton\n");
return 1;
}
err = gnutls_sniffer__load(skel);
if (err) {
fprintf(stderr, "Failed to load/verify BPF skeleton: %d\n", err);
goto cleanup;
}
err = gnutls_sniffer__attach(skel);
if (err) {
fprintf(stderr, "Failed to attach BPF skeleton: %d\n", err);
goto cleanup;
}
rb = ring_buffer__new(bpf_map__fd(skel->maps.events), handle_event, NULL, NULL);
if (!rb) {
err = -errno;
fprintf(stderr, "Failed to create ring buffer: %d\n", err);
goto cleanup;
}
printf("GnuTLS sniffer attached. Press Ctrl+C to exit.\n");
while (1) {
err = ring_buffer__poll(rb, 100);
if (err < 0) {
fprintf(stderr, "Error polling ring buffer\n");
break;
}
}
cleanup:
ring_buffer__free(rb);
gnutls_sniffer__destroy(skel);
return err < 0 ? -err : 0;
}
Same results
GnuTLS sniffer attached. Press Ctrl+C to exit.
--- Perf Event ---
Process: curl, Type: SEND, Bytes: 95
Data (first 95 bytes):
GET /robots.txt HTTP/1.1
Host: www.hamza-megahed.com
User-Agent: curl/8.12.1
Accept: */*
--- Perf Event ---
Process: curl, Type: RECV, Bytes: 1174
Data (first 1174 bytes):
HTTP/1.1 200 OK
Date: Sun, 02 Mar 2025 21:34:37 GMT
[...]
User-agent: *
Sitemap: https://www.hamza-megahed.com/sitemap.xml
Tracepoints are static instrumentation points compiled into the kernel at code locations chosen by kernel developers. They are placed in meaningful logical places in the code—such as the allocation of memory, the scheduling of tasks, or network packet events—so that when enabled, they can provide consistent and stable data about kernel events. Unlike kprobes, which dynamically instrument arbitrary functions at runtime, tracepoints are predefined by the kernel and remain stable across kernel versions. This makes them a preferred interface whenever a suitable tracepoint is available for the event you are interested in. Tracepoint eBPF programs are classified under the program type BPF_PROG_TYPE_TRACEPOINT.
Disabled tracepoint
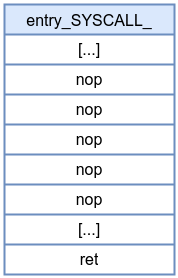
Enabled tracepoint:
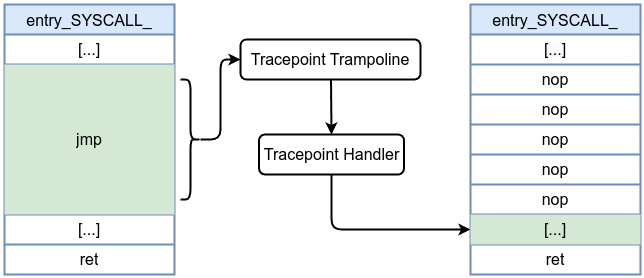
To list all available tracepoints in a Linux system, you can use either sudo bpftrace -l 'tracepoint:*' or sudo ls /sys/kernel/debug/tracing/events/ directory or /sys/kernel/tracing/available_events file which contains a list of all available tracepoints on the system. The SEC name usually follows the format tracepoint__<category>__<name>, for example, SEC("tracepoint/syscalls/sys_enter_unlinkat"). Similarly, the context structure for tracepoints typically follows the naming convention trace_event_raw_<name> (e.g., trace_event_raw_sys_enter and trace_event_raw_sys_exit).
However, there are exceptions. For instance, in the libbpf-bootstrap example, you’ll find:
SEC("tp/sched/sched_process_exit")
int handle_exit(struct trace_event_raw_sched_process_template *ctx)
Here, the context name should be trace_event_raw_sched_process_exit rather than trace_event_raw_sched_process_template. You can verify the correct context by checking the vmlinux.h file.
Let’s explore one of the defined tracepoints from the kernel source code include/trace/events/net.h:
DECLARE_EVENT_CLASS(net_dev_template,
TP_PROTO(struct sk_buff *skb),
TP_ARGS(skb),
TP_STRUCT__entry(
__field( void *, skbaddr )
__field( unsigned int, len )
__string( name, skb->dev->name )
),
TP_fast_assign(
__entry->skbaddr = skb;
__entry->len = skb->len;
__assign_str(name);
),
TP_printk("dev=%s skbaddr=%p len=%u",
__get_str(name), __entry->skbaddr, __entry->len)
)
DEFINE_EVENT(net_dev_template, net_dev_queue,
TP_PROTO(struct sk_buff *skb),
TP_ARGS(skb)
);
DEFINE_EVENT(net_dev_template, netif_receive_skb,
TP_PROTO(struct sk_buff *skb),
TP_ARGS(skb)
);
DEFINE_EVENT(net_dev_template, netif_rx,
TP_PROTO(struct sk_buff *skb),
TP_ARGS(skb)
);
Tracepoints are defined using macros like DECLARE_EVENT_CLASS and DEFINE_EVENT. For example, netif_rx is defined as a trace event that logs information about received packets.
DEFINE_EVENT(net_dev_template, netif_rx,
TP_PROTO(struct sk_buff *skb),
TP_ARGS(skb)
);
In net/core/dev.c, inside the netif_rx_internal() function:
static int netif_rx_internal(struct sk_buff *skb)
{
int ret;
net_timestamp_check(READ_ONCE(net_hotdata.tstamp_prequeue), skb);
trace_netif_rx(skb);
#ifdef CONFIG_RPS
if (static_branch_unlikely(&rps_needed)) {
struct rps_dev_flow voidflow, *rflow = &voidflow;
int cpu;
rcu_read_lock();
cpu = get_rps_cpu(skb->dev, skb, &rflow);
if (cpu < 0)
cpu = smp_processor_id();
ret = enqueue_to_backlog(skb, cpu, &rflow->last_qtail);
rcu_read_unlock();
[...]
You can see trace_netif_rx(skb);. This call triggers the tracepoint event for packet reception which logs the event if tracing is enabled.
Then by running gdb /usr/lib/debug/boot/vmlinux-$(uname -r)
(gdb) disassemble netif_rx_internal
Dump of assembler code for function netif_rx_internal:
0xffffffff81a23d70 <+0>: call 0xffffffff8108d360 <__fentry__>
0xffffffff81a23d75 <+5>: push %rbx
0xffffffff81a23d76 <+6>: sub $0x18,%rsp
0xffffffff81a23d7a <+10>: mov %gs:0x28,%rbx
0xffffffff81a23d83 <+19>: mov %rbx,0x10(%rsp)
0xffffffff81a23d88 <+24>: mov %rdi,%rbx
0xffffffff81a23d8b <+27>: xchg %ax,%ax
0xffffffff81a23d8d <+29>: nopl 0x0(%rax,%rax,1)
0xffffffff81a23d92 <+34>: xchg %ax,%ax
0xffffffff81a23d94 <+36>: mov %gs:0x7e611471(%rip),%esi # 0x3520c <pcpu_hot+12>
0xffffffff81a23d9b <+43>: mov %rbx,%rdi
0xffffffff81a23d9e <+46>: lea 0x8(%rsp),%rdx
0xffffffff81a23da3 <+51>: call 0xffffffff81a239e0 <enqueue_to_backlog>
0xffffffff81a23da8 <+56>: mov %eax,%ebx
[...]
The disassembly confirms that at address <+29> you see a reserved 5-byte NOP (shown as nopl 0x0(%rax,%rax,1)). This placeholder is exactly what the kernel uses for its dynamic patching mechanism—when the tracepoint (or static call) is enabled, that NOP will be patched into a jump to the corresponding trampoline (and ultimately to the tracepoint handler).
In the next example, we will examine unlinkat syscall entry point (which removes a directory entry relative to a directory file descriptor) with context trace_event_raw_sys_enter , but what exactly is the content of struct trace_event_raw_sys_enter. We can get the content by searching the vmlinux.h
struct trace_event_raw_sys_enter {
struct trace_entry ent;
long int id;
long unsigned int args[6];
char __data[0];
};
Using trace_event_raw_sys_enter as context supports BTF. You can also define the context by using the old approach by defining a structure matching the same parameters defined in the format file. For example, for the unlinkat syscall, this file is located at /sys/kernel/debug/tracing/events/syscalls/sys_enter_unlinkat/format which has the following content
name: sys_enter_unlinkat
ID: 849
format:
field:unsigned short common_type; offset:0; size:2; signed:0;
field:unsigned char common_flags; offset:2; size:1; signed:0;
field:unsigned char common_preempt_count; offset:3; size:1; signed:0;
field:int common_pid; offset:4; size:4; signed:1;
field:int __syscall_nr; offset:8; size:4; signed:1;
field:int dfd; offset:16; size:8; signed:0;
field:const char * pathname; offset:24; size:8; signed:0;
field:int flag; offset:32; size:8; signed:0;
print fmt: "dfd: 0x%08lx, pathname: 0x%08lx, flag: 0x%08lx", ((unsigned long)(REC->dfd)), ((unsigned long)(REC->pathname)), ((unsigned long)(REC->flag))
Based on this information, we can deduce that the corresponding structure looks like the following:
struct trace_event_raw_sys_enter_unlinkat {
long dfd;
long pathname_ptr;
long flag;
};
Then the program can use a pointer of type of that structure as context as in int trace_unlinkat(struct trace_event_raw_sys_enter_unlinkat* ctx) However, this approach is not ideal at all for portability.
If we look at the prototype int unlinkat(int dirfd, const char *pathname, int flags); which takes the following parameters:
dirfd: This is a directory file descriptor. When the pathname provided is relative, it’s interpreted relative to this directory.
pathname: This is the path of the file or directory to remove. If the pathname is absolute (starts with a /), the dirfd parameter is ignored.
flags: This parameter allows you to modify the behavior of the call. Typically, it is set to 0 for removing files. If you want to remove a directory, you must include the AT_REMOVEDIR flag, which tells the system to remove the directory instead of a regular file.
Let’s attach a probe to the entry point of the unlinkat syscall. As you’ll see, using more examples makes the process even easier.
#define __TARGET_ARCH_x86
#include "vmlinux.h"
#include <bpf/bpf_helpers.h>
#include <bpf/bpf_tracing.h>
#include <bpf/bpf_core_read.h>
struct event {
__u32 pid;
char comm[16];
char filename[256];
};
struct {
__uint(type, BPF_MAP_TYPE_RINGBUF);
__uint(max_entries, 4096);
} events SEC(".maps");
char _license[] SEC("license") = "GPL";
SEC("tracepoint/syscalls/sys_enter_unlinkat")
int trace_unlinkat(struct trace_event_raw_sys_enter* ctx) {
struct event *evt;
evt = bpf_ringbuf_reserve(&events, sizeof(struct event), 0);
if (!evt)
return 0;
evt->pid = bpf_get_current_pid_tgid() >> 32;
bpf_get_current_comm(&evt->comm, sizeof(evt->comm));
bpf_probe_read_user_str(&evt->filename, sizeof(evt->filename), (const char *)ctx->args[1]);
bpf_ringbuf_submit(evt, 0);
return 0;
}
We captured the pathname by accessing the second argument (pathname is the second argument in unlinkat syscall) in the context’s args array, as shown in:
bpf_probe_read_user_str(&evt->filename, sizeof(evt->filename), (const char *)ctx->args[1]);
By creating and removing files and directories, you should see similar output:
Successfully started! Listening for events...
Process ID: 1899, Command: rm, Filename: test1
Process ID: 1914, Command: rm, Filename: test2
Process ID: 1918, Command: rm, Filename: test3
As you saw, there tremendous amount of possibilities of using such probes, such as using tracepoint:syscalls:sys_enter_connect which allows you to monitor when a process initiates a network connection using the connect() system call, and this is just the tip of the iceberg.
Raw tracepoints provide a lower-level interface to the same static instrumentation points used by regular tracepoints, but without the overhead of argument type casting and stable ABI guarantees. Introduced in Linux 4.17 by Alexei Starovoitov. Whereas normal tracepoints provide a stable set of arguments, often cast into well-defined data structures, raw tracepoints give direct access to the arguments in the form used by the kernel’s tracepoint handler. This means there’s no guarantee about the argument layout staying consistent across kernel versions—if the kernel’s internal definition of the tracepoint changes, your raw tracepoint program must adapt. Raw tracepoints attach to the same kernel tracepoints as normal tracepoint-based BPF programs. You specify a raw tracepoint by name, just as you would a regular tracepoint, but you load the BPF program with a type that indicates you want raw access, such as BPF_PROG_TYPE_TRACING with a section prefix like raw_tp/ or tp_btf/.
Raw tracepoints use the same static jump patching mechanism as regular tracepoints, they differ in that they pass unformatted, low-level event data directly to the attached program.
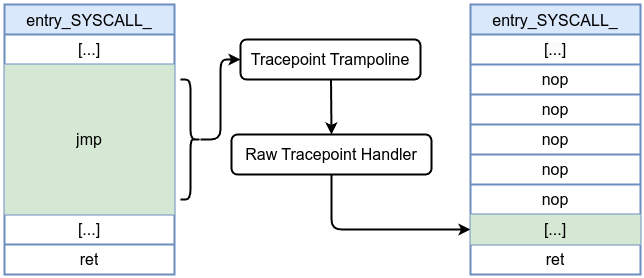
The list of all raw tracepoints are available at /sys/kernel/debug/tracing/available_events file
Raw tracepoints are not defined for each individual syscall but are provided as generic entry and exit points (such as sys_enter and sys_exit) for all system calls. Therefore, if you want to target a specific syscall, you must filter events by checking the syscall ID.
Raw tracepoint uses bpf_raw_tracepoint_args data structure as context which is defined in include/uapi/linux/bpf.has the following:
struct bpf_raw_tracepoint_args {
__u64 args[0];
};
To understand what the arguments point to in the case of sys_enter, you should examine include/trace/events/syscalls.h.
TRACE_EVENT_SYSCALL(sys_enter,
TP_PROTO(struct pt_regs *regs, long id),
TP_ARGS(regs, id),
TP_STRUCT__entry(
__field( long, id )
__array( unsigned long, args, 6 )
),
TP_fast_assign(
__entry->id = id;
syscall_get_arguments(current, regs, __entry->args);
),
TP_printk("NR %ld (%lx, %lx, %lx, %lx, %lx, %lx)",
__entry->id,
__entry->args[0], __entry->args[1], __entry->args[2],
__entry->args[3], __entry->args[4], __entry->args[5]),
syscall_regfunc, syscall_unregfunc
);
It has args as args[0] -> points to pt_regs structure and args[1] is the syscall number.
To access the target syscalls’ parameters, you can either cast ctx->args[0] to a pointer to a struct pt_regs and use it directly, or copy its contents into a local variable of type struct pt_regs (e.g., struct pt_regs regs;). Then, you can extract the syscall parameters using the PT_REGS_PARM macros (such as PT_REGS_PARM1, PT_REGS_PARM2, etc.).
#define __TARGET_ARCH_x86
#include "vmlinux.h"
#include <bpf/bpf_helpers.h>
#include <bpf/bpf_tracing.h>
#include <bpf/bpf_core_read.h>
struct event {
__u32 pid;
char comm[16];
char filename[256];
};
struct {
__uint(type, BPF_MAP_TYPE_RINGBUF);
__uint(max_entries, 4096);
} events SEC(".maps");
char LICENSE[] SEC("license") = "GPL";
SEC("raw_tracepoint/sys_enter")
int trace_unlinkat_raw(struct bpf_raw_tracepoint_args *ctx)
{
struct pt_regs regs;
if (bpf_probe_read(®s, sizeof(regs), (void *)ctx->args[0]) != 0)
return 0;
// The syscall number is stored in ctx->args[1]
long syscall_id = ctx->args[1];
if (syscall_id != 263)
return 0;
const char *pathname = (const char *)PT_REGS_PARM2(®s);
struct event *evt = bpf_ringbuf_reserve(&events, sizeof(struct event), 0);
if (!evt)
return 0;
evt->pid = bpf_get_current_pid_tgid() >> 32;
bpf_get_current_comm(evt->comm, sizeof(evt->comm));
int ret = bpf_probe_read_user_str(evt->filename, sizeof(evt->filename), pathname);
if (ret < 0)
evt->filename[0] = '\0';
bpf_ringbuf_submit(evt, 0);
return 0;
}
User-space code
#include <stdio.h>
#include <signal.h>
#include <stdlib.h>
#include <unistd.h>
#include <bpf/libbpf.h>
#include "rtp_unlinkat.skel.h"
static volatile bool exiting = false;
static void sig_handler(int signo)
{
exiting = true;
}
struct event {
__u32 pid;
char comm[16];
char filename[256];
};
static int handle_event(void *ctx, void *data, size_t data_sz)
{
const struct event *e = data;
printf("PID: %u, COMM: %s, FILENAME: %s\n", e->pid, e->comm, e->filename);
return 0;
}
int main(int argc, char **argv)
{
struct rtp_unlinkat *skel;
struct ring_buffer *rb = NULL;
int err;
libbpf_set_strict_mode(LIBBPF_STRICT_ALL);
skel = rtp_unlinkat__open();
if (!skel) {
fprintf(stderr, "Failed to open BPF skeleton\n");
return 1;
}
err = rtp_unlinkat__load(skel);
if (err) {
fprintf(stderr, "Failed to load BPF skeleton: %d\n", err);
goto cleanup;
}
err = rtp_unlinkat__attach(skel);
if (err) {
fprintf(stderr, "Failed to attach BPF skeleton: %d\n", err);
goto cleanup;
}
rb = ring_buffer__new(bpf_map__fd(skel->maps.events), handle_event, NULL, NULL);
if (!rb) {
fprintf(stderr, "Failed to create ring buffer\n");
err = 1;
goto cleanup;
}
signal(SIGINT, sig_handler);
printf("Waiting for events... Press Ctrl+C to exit.\n");
while (!exiting) {
err = ring_buffer__poll(rb, 100);
if (err < 0) {
fprintf(stderr, "Error polling ring buffer: %d\n", err);
break;
}
}
cleanup:
ring_buffer__free(rb);
rtp_unlinkat__destroy(skel);
return err < 0 ? -err : 0;
}
The output:
PID: 3440, COMM: rm, FILENAME: test1
PID: 3442, COMM: rm, FILENAME: test2
Let’s explore another example other than sys_enter. The following is raw tracepoint task_rename which is triggered when a process change its command name. Detecting such activity is crucial in security field such as malware try to hide its true identity or mimic a trusted process such as using prctl(PR_SET_NAME) to change the name of comm.
By examining task_rename tracing event source code located in include/trace/events/task.h,we can see how the tracing mechanism is implemented:
TRACE_EVENT(task_rename,
TP_PROTO(struct task_struct *task, const char *comm),
TP_ARGS(task, comm),
TP_STRUCT__entry(
__field( pid_t, pid)
__array( char, oldcomm, TASK_COMM_LEN)
__array( char, newcomm, TASK_COMM_LEN)
__field( short, oom_score_adj)
),
TP_fast_assign(
__entry->pid = task->pid;
memcpy(entry->oldcomm, task->comm, TASK_COMM_LEN);
strscpy(entry->newcomm, comm, TASK_COMM_LEN);
__entry->oom_score_adj = task->signal->oom_score_adj;
),
TP_printk("pid=%d oldcomm=%s newcomm=%s oom_score_adj=%hd",
__entry->pid, __entry->oldcomm,
__entry->newcomm, __entry->oom_score_adj)
);
From TP_PTORO, we can see that the first argument ctx->args[0] is pointing to struct task_struct *task and the second ctx->args[1] argument is pointing to const char *comm:
TP_PROTO(struct task_struct *task, const char *comm)
struct task_struct data structure is defined in include/linux/sched.h. Let’s see the following code:
#define __TARGET_ARCH_x86
#include "vmlinux.h"
#include <bpf/bpf_helpers.h>
#include <bpf/bpf_tracing.h>
#include <bpf/bpf_core_read.h>
#ifndef TASK_COMM_LEN
#define TASK_COMM_LEN 16
#endif
struct event {
u32 pid;
u32 parent_pid;
char new_comm[TASK_COMM_LEN];
char old_comm[TASK_COMM_LEN];
};
struct {
__uint(type, BPF_MAP_TYPE_RINGBUF);
__uint(max_entries, 1 << 12);
} events SEC(".maps");
char LICENSE[] SEC("license") = "GPL";
SEC("raw_tracepoint/task_rename")
int raw_tracepoint_task_rename(struct bpf_raw_tracepoint_args *ctx)
{
struct task_struct *task = (struct task_struct *)ctx->args[0];
const char *new_comm_ptr = (const char *)ctx->args[1];
struct event *e = bpf_ringbuf_reserve(&events, sizeof(*e), 0);
if (!e)
return 0;
e->pid = BPF_CORE_READ(task, pid);
struct task_struct *parent = BPF_CORE_READ(task, real_parent);
e->parent_pid = BPF_CORE_READ(parent, pid);
bpf_probe_read_kernel_str(e->old_comm, sizeof(e->old_comm), task->comm);
bpf_probe_read_kernel_str(e->new_comm, sizeof(e->new_comm), new_comm_ptr);
bpf_ringbuf_submit(e, 0);
return 0;
}
The first argument ctx->args[0] is pointing to struct task_struct *task and the second ctx->args[1] argument is pointing to const char *comm:
struct task_struct *task = (struct task_struct *)ctx->args[0];
const char *new_comm_ptr = (const char *)ctx->args[1];
User-space code:
#include <stdio.h>
#include <stdlib.h>
#include <signal.h>
#include <unistd.h>
#include <errno.h>
#include <bpf/libbpf.h>
#include "task_rename_ringbuf.skel.h"
struct event {
__u32 pid;
__u32 parent_pid;
char new_comm[16];
char old_comm[16];
};
static int handle_event(void *ctx, void *data, size_t data_sz)
{
struct event *e = data;
printf("pid=%u, parent_pid=%u, new_comm=%s, old_comm=%s\n",
e->pid, e->parent_pid, e->new_comm, e->old_comm);
return 0;
}
int main(int argc, char **argv)
{
struct task_rename_ringbuf_bpf *skel;
struct ring_buffer *rb = NULL;
int err;
skel = task_rename_ringbuf_bpf__open();
if (!skel) {
fprintf(stderr, "ERROR: failed to open BPF skeleton\n");
return 1;
}
err = task_rename_ringbuf_bpf__load(skel);
if (err) {
fprintf(stderr, "ERROR: failed to load BPF skeleton: %d\n", err);
goto cleanup;
}
err = task_rename_ringbuf_bpf__attach(skel);
if (err) {
fprintf(stderr, "ERROR: failed to attach BPF skeleton: %d\n", err);
goto cleanup;
}
rb = ring_buffer__new(bpf_map__fd(skel->maps.events), handle_event, NULL, NULL);
if (!rb) {
err = -errno;
fprintf(stderr, "ERROR: failed to create ring buffer: %d\n", err);
goto cleanup;
}
printf("Waiting for task_rename events... Press Ctrl+C to exit.\n");
while (1) {
err = ring_buffer__poll(rb, 100);
if (err < 0 && err != -EINTR) {
fprintf(stderr, "ERROR: polling ring buffer failed: %d\n", err);
break;
}
}
cleanup:
ring_buffer__free(rb);
task_rename_ringbuf_bpf__destroy(skel);
return -err;
}
Now let’s create a simple code to use prctl(PR_SET_NAME) to change comm name:
#include <stdio.h>
#include <unistd.h>
#include <sys/prctl.h>
#include <string.h>
#include <errno.h>
int main(void) {
char current_name[16] = {0};
if (prctl(PR_GET_NAME, (unsigned long)current_name, 0, 0, 0) != 0) {
perror("prctl(PR_GET_NAME)");
return 1;
}
printf("Current process name: %s\n", current_name);
const char *fake_name = "systemd";
if (prctl(PR_SET_NAME, (unsigned long)fake_name, 0, 0, 0) != 0) {
perror("prctl(PR_SET_NAME)");
return 1;
}
memset(current_name, 0, sizeof(current_name));
if (prctl(PR_GET_NAME, (unsigned long)current_name, 0, 0, 0) != 0) {
perror("prctl(PR_GET_NAME)");
return 1;
}
printf("Process name changed to: %s\n", current_name);
sleep(120);
return 0;
}
Compile it using gcc fake.c -o fake then run it ./fake
Waiting for task_rename events... Press Ctrl+C to exit.
pid=7839, parent_pid=7478, new_comm=fake, old_comm=bash
pid=7839, parent_pid=7478, new_comm=systemd, old_comm=fake
Then process changed it’s comm from fake to systemd. We can confirm by
cat /proc/7839/comm
systemd
Or using top command, top --pid 7839
top - 04:57:06 up 4:42, 6 users, load average: 0.02, 0.01, 0.00
Tasks: 1 total, 0 running, 1 sleeping, 0 stopped, 0 zombie
%Cpu(s): 0.1 us, 0.1 sy, 0.0 ni, 99.8 id, 0.0 wa, 0.0 hi, 0.0 si, 0.0 st
MiB Mem : 3921.3 total, 1481.0 free, 1199.2 used, 1534.0 buff/cache
MiB Swap: 3169.0 total, 3169.0 free, 0.0 used. 2722.1 avail Mem
PID USER PR NI VIRT RES SHR S %CPU %MEM TIME+ COMMAND
7839 ebpf 20 0 2560 1616 1616 S 0.0 0.0 0:00.00 systemd
An fentry eBPF program is attached precisely at the entry point of a kernel function. Introduced in Linux kernel 5.5 , fentry uses a BPF trampoline to patch function entry points to invoke eBPF code. This results in minimal overhead compared to traditional kprobe.
__fentry__ at the beginning of the function which contains several NOP instructions 0x90.Fentry-based and fexit-based eBPF programs are classified under the program type BPF_PROG_TYPE_TRACING.
By looking at the entry is a kernel function such as do_set_acl. First we need to download debug symbols for the kernel, on debian just sudo apt-get install linux-image-$(uname -r)-dbg and the debug symbols will be at /usr/lib/debug/boot/vmlinux-$(uname -r).
Getting the entry point of do_set_acl using objdump -d vmlinux-$(uname -r) | grep -A 10 "<do_set_acl>:"
ffffffff814d7d20 <do_set_acl>:
ffffffff814d7d20: f3 0f 1e fa endbr64
ffffffff814d7d24: e8 37 56 bb ff call ffffffff8108d360 <__fentry__>
ffffffff814d7d29: 41 55 push %r13
ffffffff814d7d2b: 49 89 d5 mov %rdx,%r13
ffffffff814d7d2e: 41 54 push %r12
ffffffff814d7d30: 49 89 f4 mov %rsi,%r12
ffffffff814d7d33: 55 push %rbp
ffffffff814d7d34: 48 89 fd mov %rdi,%rbp
ffffffff814d7d37: 53 push %rbx
ffffffff814d7d38: 4d 85 c0 test %r8,%r8
We can look at __fentry__ using objdump -d vmlinux-$(uname -r) | grep -A 15 "<__fentry__>:"
ffffffff8108d360 <__fentry__>:
ffffffff8108d360: f3 0f 1e fa endbr64
ffffffff8108d364: 90 nop
ffffffff8108d365: 90 nop
ffffffff8108d366: 90 nop
ffffffff8108d367: 90 nop
ffffffff8108d368: 90 nop
ffffffff8108d369: 90 nop
ffffffff8108d36a: 90 nop
ffffffff8108d36b: 90 nop
ffffffff8108d36c: 90 nop
ffffffff8108d36d: e9 ee de c6 00 jmp ffffffff81cfb260 <__x86_return_thunk>
ffffffff8108d372: 66 66 2e 0f 1f 84 00 data16 cs nopw 0x0(%rax,%rax,1)
ffffffff8108d379: 00 00 00 00
ffffffff8108d37d: 0f 1f 00 nopl (%rax)
Before inserting an fentry probe:
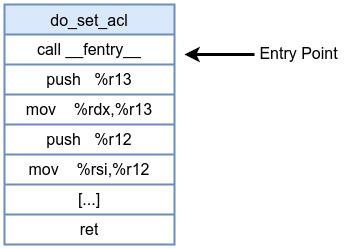
After inserting an fentry probe (with BPF trampoline):
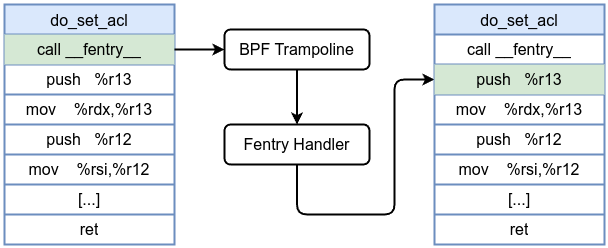
Let’s see the following example, which attaches a probe to the entry of do_set_acl kernel function. do_set_acl is a kernel function that implements the setting of Access Control Lists (ACLs) on files and directories, enabling granular permission control beyond standard Unix permissions.
#define __TARGET_ARCH_x86
#include "vmlinux.h"
#include <bpf/bpf_helpers.h>
#include <bpf/bpf_tracing.h>
#include <bpf/bpf_core_read.h>
char LICENSE[] SEC("license") = "GPL";
SEC("fentry/do_set_acl")
int BPF_PROG(handle_do_set_acl,
struct mnt_idmap *idmap,
struct dentry *dentry,
const char *acl_name,
const void *kvalue,
size_t size)
{
char acl[64] = {};
char dname[64] = {};
if (acl_name) {
if (bpf_probe_read_kernel_str(acl, sizeof(acl), acl_name) < 0)
return 0;
}
const char *name_ptr = (const char *)BPF_CORE_READ(dentry, d_name.name);
if (name_ptr) {
if (bpf_probe_read_kernel_str(dname, sizeof(dname), name_ptr) < 0)
return 0;
}
bpf_printk("do_set_acl: dentry=%s, acl_name=%s\n",
dname, acl);
return 0;
}
do_set_acl is defined in fs/posix_acl.c as the following:
int do_set_acl(struct mnt_idmap *idmap, struct dentry *dentry,
const char *acl_name, const void *kvalue, size_t size)
We can also obtain the parameters using sudo bpftrace -lv 'fentry:do_set_acl' (bpftrace will be explained in details later):
fentry:vmlinux:do_set_acl
struct mnt_idmap * idmap
struct dentry * dentry
const char * acl_name
const void * kvalue
size_t size
int retval
user-space code:
#include <stdio.h>
#include <unistd.h>
#include <sys/resource.h>
#include <bpf/libbpf.h>
#include "fentry.skel.h"
static int libbpf_print_fn(enum libbpf_print_level level, const char *format, va_list args)
{
return vfprintf(stderr, format, args);
}
int main(int argc, char **argv)
{
struct fentry *skel;
int err;
libbpf_set_print(libbpf_print_fn);
skel = fentry__open();
if (!skel) {
fprintf(stderr, "Failed to open BPF skeleton\n");
return 1;
}
err = fentry__load(skel);
if (err) {
fprintf(stderr, "Failed to load and verify BPF skeleton\n");
goto cleanup;
}
err = fentry__attach(skel);
if (err) {
fprintf(stderr, "Failed to attach BPF skeleton\n");
goto cleanup;
}
printf("Successfully started! Please run `sudo cat /sys/kernel/debug/tracing/trace_pipe` "
"to see output of the BPF programs.\n");
for (;;) {
fprintf(stderr, ".");
sleep(1);
}
cleanup:
fentry__destroy(skel);
return -err;
}
Executing setctl to change ACL such as setfacl -m u:test:rwx /tmp/file1 or setfacl -m u:test:rwx /etc/passwd
<...>-3776 [...] do_set_acl: dentry=file1, acl_name=system.posix_acl_access
setfacl-3777 [...] do_set_acl: dentry=passwd, acl_name=system.posix_acl_access
An fexit eBPF program is attached at the point when a kernel function returns (exits). Introduced alongside fentry, fexit programs also leverage the BPF trampoline. When you attach an fexit program, the kernel finds and patches the return instruction in the function to jump to BPF trampoline. That trampoline then calls your fexit handler before finally returning to the caller. Unlike traditional kretprobe, fexit programs have direct access to both the input parameters of the traced kernel function and its return value. Thus, you don’t need to use additional maps or state tracking to record inputs before function execution.
Before inserting an fexit probe:
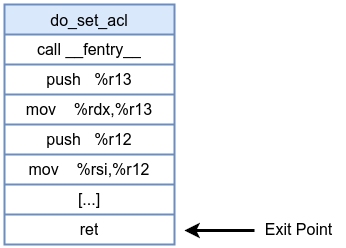
After inserting an fexit probe (with BPF trampoline):
Let’s explore the following example which is attach a probe to return of do_set_acl kernel function.
#define __TARGET_ARCH_x86
#include "vmlinux.h"
#include <bpf/bpf_helpers.h>
#include <bpf/bpf_tracing.h>
#include <bpf/bpf_core_read.h>
char LICENSE[] SEC("license") = "GPL";
SEC("fexit/do_set_acl")
int BPF_PROG(handle_do_set_acl,
struct mnt_idmap *idmap,
struct dentry *dentry,
const char *acl_name,
const void *kvalue,
size_t size,
int retval)
{
char acl[64] = {};
char dname[64] = {};
if (acl_name) {
if (bpf_probe_read_kernel_str(acl, sizeof(acl), acl_name) < 0)
return 0;
}
const char *name_ptr = (const char *)BPF_CORE_READ(dentry, d_name.name);
if (name_ptr) {
if (bpf_probe_read_kernel_str(dname, sizeof(dname), name_ptr) < 0)
return 0;
}
bpf_printk("do_set_acl: dentry=%s, acl_name=%s, retval=%d\n",
dname, acl, retval);
return 0;
}
user-space code:
#include <stdio.h>
#include <unistd.h>
#include <sys/resource.h>
#include <bpf/libbpf.h>
#include "fexit.skel.h"
static int libbpf_print_fn(enum libbpf_print_level level, const char *format, va_list args)
{
return vfprintf(stderr, format, args);
}
int main(int argc, char **argv)
{
struct fexit *skel;
int err;
libbpf_set_print(libbpf_print_fn);
skel = fexit__open();
if (!skel) {
fprintf(stderr, "Failed to open BPF skeleton\n");
return 1;
}
err = fexit__load(skel);
if (err) {
fprintf(stderr, "Failed to load and verify BPF skeleton\n");
goto cleanup;
}
err = fexit__attach(skel);
if (err) {
fprintf(stderr, "Failed to attach BPF skeleton\n");
goto cleanup;
}
printf("Successfully started! Please run `sudo cat /sys/kernel/debug/tracing/trace_pipe` "
"to see output of the BPF programs.\n");
for (;;) {
fprintf(stderr, ".");
sleep(1);
}
cleanup:
fexit__destroy(skel);
return -err;
}
setfacl-3861 [...] do_set_acl: dentry=file1, acl_name=system.posix_acl_access, retval=0
<...>-3862 [...] do_set_acl: dentry=passwd, acl_name=system.posix_acl_access, retval=-1
Fexit programs have direct access to both the input parameters of the traced kernel function and its return value.
We saw socket filter program type definition in previous chapter, a SOCKET_FILTER type program executes whenever a packet arrives at the socket it is attached to give you access to examine all packets passed through the socket and can’t give you control to modify packets and believe me, it’s easier than you think, all you have to do is to look at the the entire packet structure as we will see. Socket filter eBPF programs are classified under the program type BPF_PROG_TYPE_SOCKET_FILTER.
The socket buffer (or sk_buff) is the primary structure used within the Linux kernel to represent network packets. It stores not only the packet data itself but also various metadata such as header pointers, packet lengths, protocol information, and state flags. sk_buff is defined in include/linux/skbuff.h and it has four major pointers:
These four pointers provide the framework for managing the packet data within a single contiguous memory allocation. The sk_buff’s allocated memory region divided into several logical segments that these pointers describe:
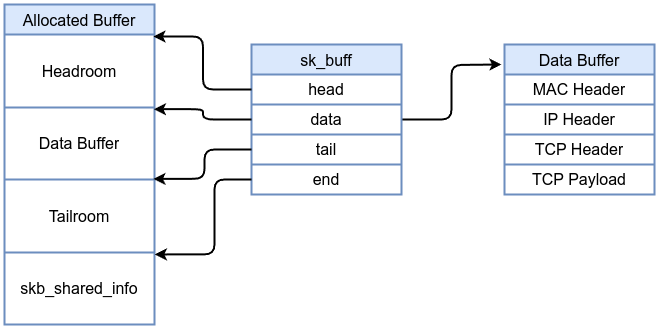
__sk_buff data structure is a simplified version of sk_buff structure that’s exposed to eBPF programs. It provides a subset of information about a network packet that eBPF programs can use to inspect, filter, or even modify packets without needing access to all the internals of the full sk_buff.
__sk_buff used as context for eBPF programs such as in socket filter programs. __sk_buff is defined in include/uapi/linux/bpf.h as:
struct __sk_buff {
__u32 len;
__u32 pkt_type;
__u32 mark;
__u32 queue_mapping;
__u32 protocol;
__u32 vlan_present;
__u32 vlan_tci;
__u32 vlan_proto;
__u32 priority;
__u32 ingress_ifindex;
__u32 ifindex;
__u32 tc_index;
__u32 cb[5];
__u32 hash;
__u32 tc_classid;
__u32 data;
__u32 data_end;
__u32 napi_id;
__u32 family;
__u32 remote_ip4;
__u32 local_ip4;
__u32 remote_ip6[4];
__u32 local_ip6[4];
__u32 remote_port;
__u32 local_port;
__u32 data_meta;
__bpf_md_ptr(struct bpf_flow_keys *, flow_keys);
__u64 tstamp;
__u32 wire_len;
__u32 gso_segs;
__bpf_md_ptr(struct bpf_sock *, sk);
__u32 gso_size;
__u8 tstamp_type;
__u32 :24;
__u64 hwtstamp;
};
Therefore, to detect an ICMP echo request packet (as in the following example), you need to perform the following checks: first, verify that it’s an IPv4 packet. If it is, then confirm that the protocol is ICMP. Finally, check if the ICMP type is an echo request or an echo reply all of that is just by reading __sk_buff using bpf_skb_load_bytes . bpf_skb_load_bytes is a helper function which can be used to load data from a packet and it has the following prototype:
`static long (* const bpf_skb_load_bytes)(const void *skb, __u32 offset, void *to, __u32 len) = (void *) 26;`
bpf_skb_load_bytes takes a pointer to sk_buff , offset which means which part of the packet you want to load or extract, a pointer to a location where you want to store the loaded or extracted data and finally, the length you want to extract.
#include "vmlinux.h"
#include <bpf/bpf_endian.h>
#include <bpf/bpf_helpers.h>
#define ETH_TYPE 12 // EtherType
#define ETH_HLEN 14 // ETH header length
#define ICMP_LEN 34 // ICMP header start point
#define ETH_P_IP 0x0800 // Internet Protocol packet
#define IPPROTO_ICMP 1 // Echo request
char _license[] SEC("license") = "GPL";
SEC("socket")
int icmp_filter_prog(struct __sk_buff *skb)
{
__u16 eth_proto = 0;
if (bpf_skb_load_bytes(skb, ETH_TYPE, ð_proto, sizeof(eth_proto)) < 0)
return 0;
eth_proto = bpf_ntohs(eth_proto);
if (eth_proto != ETH_P_IP) {
return 0;
}
__u8 ip_version = 0;
if (bpf_skb_load_bytes(skb, ETH_HLEN, &ip_version, sizeof(ip_version)) < 0)
return 0;
ip_version = ip_version >> 4;
if (ip_version != 4) {
return 0;
}
__u8 ip_proto = 0;
if (bpf_skb_load_bytes(skb, ETH_HLEN + 9, &ip_proto, sizeof(ip_proto)) < 0)
return 0;
if (ip_proto != IPPROTO_ICMP) {
return 0;
}
__u8 icmp_type = 0;
if (bpf_skb_load_bytes(skb, ICMP_LEN, &icmp_type, sizeof(icmp_type)) < 0)
return 0;
if (icmp_type != 8) {
return 0;
}
return skb->len;
}
We need to keep the following diagram in front of us to understand this code:
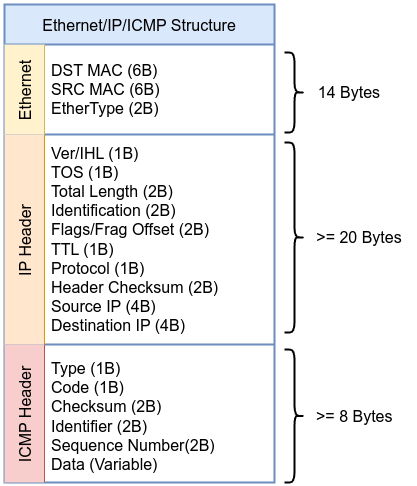
#define ETH_TYPE 12 // EtherType
#define ETH_HLEN 14 // ETH header length
#define ICMP_LEN 34 // ICMP header start point
#define ETH_P_IP 0x0800 // Internet Protocol packet
#define IPPROTO_ICMP 1 // Echo request
char _license[] SEC("license") = "GPL";
SEC("socket")
int icmp_filter_prog(struct __sk_buff *skb)
{
int offset = 0;
__u16 eth_proto = 0;
if (bpf_skb_load_bytes(skb, ETH_TYPE, ð_proto, sizeof(eth_proto)) < 0)
return 0;
eth_proto = bpf_ntohs(eth_proto);
if (eth_proto != ETH_P_IP) {
return 0;
}
First, we defined Ethernet type , Ethernet header length which is the start point of IP header, ICMP header length (Ethernet header length + IP header length). The program is defined as socket as you can see in SEC, then __sk_buff as context.
The first thing to is extract Ethernet type to determine of the packet is IP packet or not, all we need to do is get the following place in Ethernet header
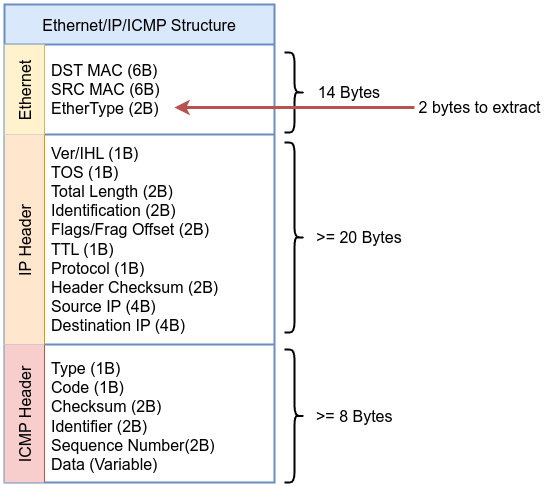
bpf_skb_load_bytes helper function will do that bpf_skb_load_bytes(skb, ETH_TYPE, ð_proto, sizeof(eth_proto)), it will extract EtherType for us and save the output in eth_proto. We define eth_proto as __u16 which is unsigned 16-bit integer and that’s why bpf_skb_load_bytes will extract in that case 2 bytes because we specified the length we need as sizeof(eth_proto).
Then we used bpf_ntohs macro which used to convert multi-byte values like EtherType, IP addresses, and port numbers from network byte order (big-endian) to host byte order, then we we perform out check if the packet is IP packet by comparing the retrieved value with 0x0800 which represent IP EtherType, as defined in the /include/uapi/linux/if_ether.h kernel source code. If the value does not match, the code will drop the packet from the socket.
The same concept goes with IP version part:
__u8 ip_version = 0;
if (bpf_skb_load_bytes(skb, ETH_HLEN, &ip_version, sizeof(ip_version)) < 0)
return 0;
ip_version = ip_version >> 4;
if (ip_version != 4) {
return 0;
}

We need to extract the first 1 byte (__u8) of the IP header. The top nibble (the first 4 bits) is the version of IP ip_version = ip_version >> 4 followed by checking if the version is 4 or drop the packet from the socket. Then we need to move to Protocol field in IP header to check if the packet is ICMP by comparing the retrieved value with 1 which represents ICMP as defined in /include/uapi/linux/in.h kernel source code. If the value does not match, the code will drop the packet from the socket.
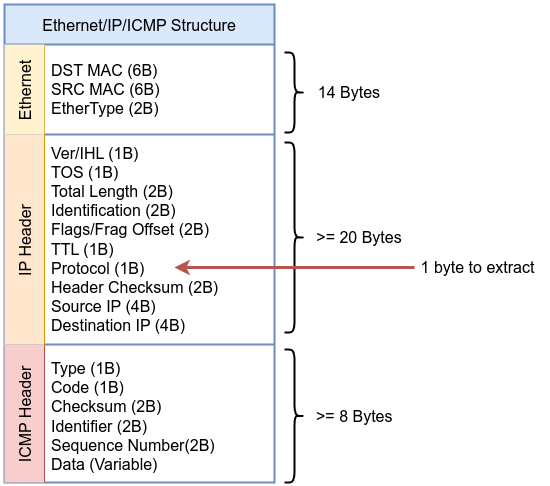
Then the last part is moving to the first byte of ICMP header and check if the packet is echo request or drop the packet from the socket. Finally, return skb->len indicated that the packet should be accepted and passed along to user space or to further processing. Let’s move to the user-space code.
#include <arpa/inet.h>
#include <errno.h>
#include <stdio.h>
#include <stdlib.h>
#include <unistd.h>
#include <sys/socket.h>
#include <net/ethernet.h>
#include <bpf/libbpf.h>
#include <bpf/bpf.h>
#include "icmp_socket_filter.skel.h"
int main(void)
{
struct icmp_socket_filter *skel = NULL;
int sock_fd = -1, prog_fd = -1, err;
skel = icmp_socket_filter__open();
if (!skel) {
fprintf(stderr, "Failed to open skeleton\n");
return 1;
}
err = icmp_socket_filter__load(skel);
if (err) {
fprintf(stderr, "Failed to load skeleton: %d\n", err);
goto cleanup;
}
prog_fd = bpf_program__fd(skel->progs.icmp_filter_prog);
if (prog_fd < 0) {
fprintf(stderr, "Failed to get program FD\n");
goto cleanup;
}
sock_fd = socket(AF_PACKET, SOCK_RAW, htons(ETH_P_ALL));
if (sock_fd < 0) {
fprintf(stderr, "Error creating raw socket: %d\n", errno);
goto cleanup;
}
err = setsockopt(sock_fd, SOL_SOCKET, SO_ATTACH_BPF, &prog_fd, sizeof(prog_fd));
if (err) {
fprintf(stderr, "setsockopt(SO_ATTACH_BPF) failed: %d\n", errno);
goto cleanup;
}
printf("Only ICMP Echo Requests (ping) will be seen by this raw socket.\n");
while (1) {
unsigned char buf[2048];
ssize_t n = read(sock_fd, buf, sizeof(buf));
if (n < 0) {
perror("read");
break;
}
printf("Received %zd bytes (ICMP echo request) on this socket\n", n);
}
cleanup:
if (sock_fd >= 0)
close(sock_fd);
icmp_socket_filter__destroy(skel);
return 0;
}
We made a few modifications to the user-space file , instead of attaching the eBPF program directly, we first,retrieve the file descriptor of the loaded eBPF program as shown below:
prog_fd = bpf_program__fd(skel->progs.icmp_filter_prog);
if (prog_fd < 0) {
fprintf(stderr, "Failed to get program FD\n");
goto cleanup;
}
The next step is creating a socket as shown in the following:
sock_fd = socket(AF_PACKET, SOCK_RAW, htons(ETH_P_ALL));
if (sock_fd < 0) {
fprintf(stderr, "Error creating raw socket: %d\n", errno);
goto cleanup;
}
Finally, attach the file descriptor of the loaded eBPF program to the created socket as in the following:
err = setsockopt(sock_fd, SOL_SOCKET, SO_ATTACH_BPF, &prog_fd, sizeof(prog_fd));
if (err) {
fprintf(stderr, "setsockopt(SO_ATTACH_BPF) failed: %d\n", errno);
goto cleanup;
}
Compile the eBPF program, then generate skeleton file. After that, compile the loader. Start the program and ping from the same machine or from an external machine. You should see output similar to the following:
Only ICMP Echo Requests (ping) will be seen by this raw socket.
Received 98 bytes (ICMP echo request) on this socket
Received 98 bytes (ICMP echo request) on this socket
Received 98 bytes (ICMP echo request) on this socket
Received 98 bytes (ICMP echo request) on this socket
Received 98 bytes (ICMP echo request) on this socket
Let’s demonstrate another simple example and yet has important benefits which is extracting a keyword from HTTP request by storing only 64 bytes from the request’s TCP payload in a buffer and searching that buffer. The buffer size significantly reduced so we don’t need to address IP fragmentation. By performing some checks as we did in the previous example until we get to the TCP payload and search in it by a magic word.
#include "vmlinux.h"
#include <bpf/bpf_endian.h>
#include <bpf/bpf_helpers.h>
#define ETH_TYPE 12
#define ETH_HLEN 14
#define ETH_P_IP 0x0800 // IPv4 EtherType
#define IPPROTO_TCP 6
#define TCP_LEN 34 // TCP header start point
#define HTTP_PORT 8080
#define HTTP_PAYLOAD_READ_LEN 64
static __always_inline int search_substring(const char *tcp_buff, int tcp_buff_len,
const char *magic_word, int magic_word_len)
{
if (magic_word_len == 0 || tcp_buff_len == 0 || magic_word_len > tcp_buff_len)
return 0;
for (int i = 0; i <= tcp_buff_len - magic_word_len; i++) {
int j;
for (j = 0; j < magic_word_len; j++) {
if (tcp_buff[i + j] != magic_word[j])
break;
}
if (j == magic_word_len) {
return 1;
}
}
return 0;
}
char _license[] SEC("license") = "GPL";
SEC("socket")
int http_filter_prog(struct __sk_buff *skb)
{
const char magic_word[] = "l33t";
int offset = 0;
__u16 eth_proto = 0;
if (bpf_skb_load_bytes(skb, ETH_TYPE, ð_proto, sizeof(eth_proto)) < 0)
return 0;
eth_proto = bpf_ntohs(eth_proto);
if (eth_proto != ETH_P_IP) {
return 0;
}
__u8 ip_version = 0;
if (bpf_skb_load_bytes(skb, ETH_HLEN, &ip_version, sizeof(ip_version)) < 0)
return 0;
ip_version = ip_version >> 4;
if (ip_version != 4) {
return 0;
}
__u8 ip_proto = 0;
if (bpf_skb_load_bytes(skb, ETH_HLEN + 9, &ip_proto, sizeof(ip_proto)) < 0)
return 0;
if (ip_proto != IPPROTO_TCP) {
return 0;
}
__u8 tcp_hdr_len = 0;
if (bpf_skb_load_bytes(skb, TCP_LEN + 12, &tcp_hdr_len, 1) < 0)
return 0;
tcp_hdr_len >>= 4;
tcp_hdr_len *= 4;
__u16 dport = 0;
if (bpf_skb_load_bytes(skb, TCP_LEN + 2, &dport, sizeof(dport)) < 0)
return 0;
dport = bpf_ntohs(dport);
if (dport != HTTP_PORT) {
return 0;
}
offset += tcp_hdr_len;
char http_buf[HTTP_PAYLOAD_READ_LEN] = {0};
if (bpf_skb_load_bytes(skb, TCP_LEN + tcp_hdr_len, &http_buf, sizeof(http_buf)) < 0)
return skb->len;
bpf_printk("packet \n%s",http_buf );
if (search_substring(http_buf, HTTP_PAYLOAD_READ_LEN, magic_word, sizeof(magic_word) - 1)) {
bpf_printk("ALERT: Magic Word Found in the HTTP request payload\n");
}
return skb->len;
}
Keep the following diagram in front of you to understand this code:
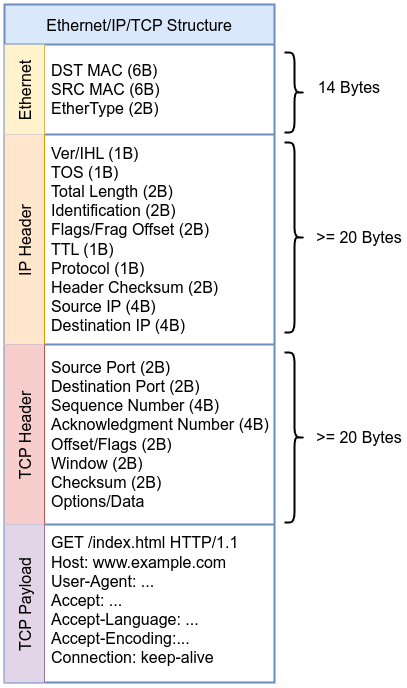
A simple search function is added to search for “l33t” in TCP payload, it can be sent via GET request such as /?id=l33t. The function, search_substring, perfroms a basic substring search algorithm. Due to its __always_inline attribute, this function offers performance benefits. The function takes the payload buffer, its length, the search term, and its length as input. It returns 1 if the search term is found within the payload, and 0 otherwise. This allows for simple pattern-based filtering of network traffic within our the eBPF program.
static __always_inline int search_substring(const char *tcp_buff, int tcp_buff_len,
const char *magic_word, int magic_word_len)
{
if (magic_word_len == 0 || tcp_buff_len == 0 || magic_word_len > tcp_buff_len)
return 0;
for (int i = 0; i <= tcp_buff_len - magic_word_len; i++) {
int j;
for (j = 0; j < magic_word_len; j++) {
if (tcp_buff[i + j] != magic_word[j])
break;
}
if (j == magic_word_len) {
return 1;
}
}
return 0;
}
Calculating TCP header size is important because we need to know where TCP payload data begins as the size of TCP header is not fixed as in the most cases of IP header due to TCP options.
__u8 tcp_hdr_len = 0;
if (bpf_skb_load_bytes(skb, TCP_LEN + 12, &tcp_hdr_len, 1) < 0)
return 0;
tcp_hdr_len >>= 4;
tcp_hdr_len *= 4;
Let’s move to user-space code
#include <arpa/inet.h>
#include <errno.h>
#include <stdio.h>
#include <stdlib.h>
#include <unistd.h>
#include <sys/socket.h>
#include <net/ethernet.h>
#include <bpf/libbpf.h>
#include <bpf/bpf.h>
static const char *BPF_OBJ_FILE = "http_extract.o";
int main(void)
{
struct bpf_object *obj = NULL;
struct bpf_program *prog;
int sock_fd = -1, prog_fd = -1, err;
obj = bpf_object__open_file(BPF_OBJ_FILE, NULL);
if (!obj) {
fprintf(stderr, "Error opening BPF object file\n");
return 1;
}
err = bpf_object__load(obj);
if (err) {
fprintf(stderr, "Error loading BPF object: %d\n", err);
bpf_object__close(obj);
return 1;
}
prog = bpf_object__find_program_by_name(obj, "http_filter_prog");
if (!prog) {
fprintf(stderr, "Error finding BPF program by name.\n");
bpf_object__close(obj);
return 1;
}
prog_fd = bpf_program__fd(prog);
if (prog_fd < 0) {
fprintf(stderr, "Error getting program FD.\n");
bpf_object__close(obj);
return 1;
}
sock_fd = socket(AF_PACKET, SOCK_RAW, htons(ETH_P_ALL));
if (sock_fd < 0) {
fprintf(stderr, "Error creating raw socket: %d\n", errno);
bpf_object__close(obj);
return 1;
}
err = setsockopt(sock_fd, SOL_SOCKET, SO_ATTACH_BPF, &prog_fd, sizeof(prog_fd));
if (err) {
fprintf(stderr, "setsockopt(SO_ATTACH_BPF) failed: %d\n", errno);
close(sock_fd);
bpf_object__close(obj);
return 1;
}
printf("BPF socket filter attached. It will detect HTTP methods on port 80.\n");
while (1) {
unsigned char buf[2048];
ssize_t n = read(sock_fd, buf, sizeof(buf));
if (n < 0) {
perror("read");
break;
}
printf("Received %zd bytes on this socket\n", n);
}
close(sock_fd);
bpf_object__close(obj);
return 0;
}
The first 4 bits of Offset/Flags field in TCP header contains the size of the TCP header tcp_hdr_len >>= 4 then multiplies the value by 4 to convert the header length from 32-bit words to bytes. Compile and start the program then start HTTP server on your machine on port 8080 or change HTTP_PORT from the code, you can use python
python3 -m http.server 8080
Then curl from another box
curl http://192.168.1.2:8080/index.html?id=l33t
And you will get similar results because we entered the magic word which is l33t in our request.
GET /index.html?id=l33t HTTP/1.1
Host: 192.168.1.2:8080
sshd-session-1423 [000] ..s11 28817.447546: bpf_trace_printk: ALERT: Magic Word Found in the HTTP request payload
This program’s ability to inspect network traffic is crucial for intrusion detection and web application firewalls. Its functionality enables security tools to identify suspicious patterns or malicious content as it passes through the network, allowing for proactive threat detection with minimal performance overhead.
Lightweight Tunnels (LWT) in the Linux kernel provides a way to handle network tunneling defined in /net/core/lwtunnel.c. Rather than being standalone protocols like TCP or UDP, these encapsulation types are identifiers used to select a specific method of wrapping packets for tunneling. For example, MPLS encapsulation wraps packets with an MPLS label stack, while SEG6 encapsulation uses an IPv6 Segment Routing header. The code below shows how these encapsulation types are mapped to human‐readable form:
switch (encap_type) {
case LWTUNNEL_ENCAP_MPLS:
return "MPLS";
case LWTUNNEL_ENCAP_ILA:
return "ILA";
case LWTUNNEL_ENCAP_SEG6:
return "SEG6";
case LWTUNNEL_ENCAP_BPF:
return "BPF";
case LWTUNNEL_ENCAP_SEG6_LOCAL:
return "SEG6LOCAL";
case LWTUNNEL_ENCAP_RPL:
return "RPL";
case LWTUNNEL_ENCAP_IOAM6:
return "IOAM6";
case LWTUNNEL_ENCAP_XFRM:
return NULL;
case LWTUNNEL_ENCAP_IP6:
case LWTUNNEL_ENCAP_IP:
case LWTUNNEL_ENCAP_NONE:
case __LWTUNNEL_ENCAP_MAX:
WARN_ON(1);
break;
}
return NULL;
}
There are four types of programs in eBPF to handle Lightweight Tunnels. Among them, BPF_PROG_TYPE_LWT_IN and BPF_PROG_TYPE_LWT_OUT are the most important.
BPF_PROG_TYPE_LWT_IN can be attached to incoming path of Lightweight Tunnel and uses lwt_in as section definition while BPF_PROG_TYPE_LWT_OUT can be attached the outgoing path of Lightweight Tunnel and used lwt_out as section definition. Both applications can add more control to the route by allowing or dropping of traffic and also inspect the traffic on a specific route but they are not allowed to modify. Information on the full capabilities of these LWT eBPF program types is limited, making them hard to fully explore.
We can build a simple BPF_PROG_TYPE_LWT_OUT program for testing without the need to make Lightweight Tunnel. The idea of this program is to block outgoing 8080 connection from 10.0.0.2 to 10.0.0.3.
#include <linux/bpf.h>
#include <linux/ip.h>
#include <linux/tcp.h>
#include <bpf/bpf_helpers.h>
#include <bpf/bpf_endian.h>
#include <linux/in.h>
char _license[] SEC("license") = "GPL";
SEC("lwt_out")
int drop_egress_port_8080(struct __sk_buff *skb) {
void *data = (void *)(long)skb->data;
void *data_end = (void *)(long)skb->data_end;
struct iphdr *iph = data;
if ((void *)iph + sizeof(*iph) > data_end)
return BPF_OK;
if (iph->protocol != IPPROTO_TCP)
return BPF_OK;
int ip_header_length = iph->ihl * 4;
struct tcphdr *tcph = data + ip_header_length;
if ((void *)tcph + sizeof(*tcph) > data_end)
return BPF_OK;
if (bpf_ntohs(tcph->dest) == 8080) {
bpf_printk("Dropping egress packet to port 8080\n");
return BPF_DROP;
}
return BPF_OK;
}
Here we utilize another technique to access packet fields without manually calculating offsets for each field. For example, we defined struct iphdr ip; from linux/ip.h header which allows us to directly access protocol fields within IP header. iphdr structure has the following definition:
struct iphdr {
#if defined(__LITTLE_ENDIAN_BITFIELD)
__u8 ihl:4,
version:4;
#elif defined (__BIG_ENDIAN_BITFIELD)
__u8 version:4,
ihl:4;
#else
#error "Please fix <asm/byteorder.h>"
#endif
__u8 tos;
__be16 tot_len;
__be16 id;
__be16 frag_off;
__u8 ttl;
__u8 protocol;
__sum16 check;
__struct_group(/* no tag */, addrs, /* no attrs */,
__be32 saddr;
__be32 daddr;
);
};
This enables us to check if the packet is TCP using if (ip.protocol != IPPROTO_TCP). If the packet is TCP, it passes the check with BPF_OK and proceeds to the next check.
tcphdrstructure has the following definition in linux/tcp.h:
struct tcphdr {
__be16 source;
__be16 dest;
__be32 seq;
__be32 ack_seq;
#if defined(__LITTLE_ENDIAN_BITFIELD)
__u16 res1:4,
doff:4,
fin:1,
syn:1,
rst:1,
psh:1,
ack:1,
urg:1,
ece:1,
cwr:1;
#elif defined(__BIG_ENDIAN_BITFIELD)
__u16 doff:4,
res1:4,
cwr:1,
ece:1,
urg:1,
ack:1,
psh:1,
rst:1,
syn:1,
fin:1;
#else
#error "Adjust your <asm/byteorder.h> defines"
#endif
__be16 window;
__sum16 check;
__be16 urg_ptr;
};
The final check is validating if the destination port is 8080 then it will drop the packet and print out message using bpf_printk.
Compile the eBPF program and attach it to your interface or tunnel using something similar to the following:
sudo ip route add 10.0.0.3/32 encap bpf out obj drop_egress_8080.o section lwt_out dev tun0
Next, setup a web server on the remote machine
python3 -m http.server 8080
Then, from the eBPF machine run
curl http://10.0.0.3:8080/index.html
You should notice that the connection is dropped and messages in /sys/kernel/debug/tracing/trace_pipe
<idle>-0 [003] b.s21 6747.667466: bpf_trace_printk: Dropping egress packet to port 8080
<idle>-0 [003] b.s21 6748.729064: bpf_trace_printk: Dropping egress packet to port 8080
<idle>-0 [003] b.s21 6749.753690: bpf_trace_printk: Dropping egress packet to port 8080
<idle>-0 [003] b.s21 6750.777898: bpf_trace_printk: Dropping egress packet to port 8080
curl-3437 [001] b..11 8589.106765: bpf_trace_printk: Dropping egress packet to port 8080
<idle>-0 [001] b.s31 8590.112358: bpf_trace_printk: Dropping egress packet to port 8080
This program for sure can be used to inspecting or monitoring, all you need to do is to replace BPF_DROP with BPF_OK. Now let’s look at BPF_PROG_TYPE_LWT_IN programs which can be attached to incoming path of Lightweight Tunnel. Let’s use the previous example and make some changes. Modifying the code to block ingress traffic originated from 10.0.0.3 on port 8080
#include <linux/bpf.h>
#include <linux/ip.h>
#include <linux/tcp.h>
#include <bpf/bpf_helpers.h>
#include <bpf/bpf_endian.h>
#include <linux/in.h>
#define TARGET_IP 0x0A000003 // 10.0.0.3 in hexadecimal
char _license[] SEC("license") = "GPL";
SEC("lwt_in")
int drop_ingress_port_8080(struct __sk_buff *skb) {
void *data = (void *)(long)skb->data;
void *data_end = (void *)(long)skb->data_end;
struct iphdr *iph = data;
if ((void *)iph + sizeof(*iph) > data_end)
return BPF_OK;
if (iph->protocol != IPPROTO_TCP)
return BPF_OK;
int ip_header_length = iph->ihl * 4;
struct tcphdr *tcph = data + ip_header_length;
if ((void *)tcph + sizeof(*tcph) > data_end)
return BPF_OK;
if (iph->saddr == bpf_htonl(TARGET_IP)) {
if (bpf_ntohs(tcph->dest) == 8080) {
bpf_printk("Dropping ingress packet to port 8080 for IP 10.0.0.3\n");
return BPF_DROP;
}
}
return BPF_OK;
}
Compile it then attach it using sudo ip route replace table local local 10.0.0.2/32 encap bpf headroom 14 in obj drop_ingress_8080.o section lwt_in dev tun0. Start a web server on eBPF machine , then from the other machine with IP address 10.0.0.3 run curl http://10.0.0.2:8080 and you should notice that the connection is dropped and messages in /sys/kernel/debug/tracing/trace_pipe
[000] b.s21 81.669152: bpf_trace_printk: Dropping ingress packet to port 8080 for IP 10.0.0.3
[000] b.s21 82.694440: bpf_trace_printk: Dropping ingress packet to port 8080 for IP 10.0.0.3
[000] b.s21 84.741651: bpf_trace_printk: Dropping ingress packet to port 8080 for IP 10.0.0.3
[000] b.s21 88.773985: bpf_trace_printk: Dropping ingress packet to port 8080 for IP 10.0.0.3
I hope these two examples were easy and straightforward, and that LWT is now clearer. Next, we’ll explore the Traffic Control subsystem, which can direct and manage traffic effectively.
Traffic Control subsystem is designed to schedule packets using a queuing system which controls the traffic direction and filtering. Traffic control can be used to filter traffic by applying rules and traffic shaping among other functions. The core of traffic control is built around qdiscs which stands for queuing disciplines, qdiscs define the rules for how packets are handled by a queuing system.
There are two types of qdiscs, classful and classless. classful qdiscs enable the creation of hierarchical queuing structures to facilitates the implementation of complex traffic management policies. Classful qdiscs consist of two parts, filters and classes. The best definition is in the man page which says the following:
Queueing Discipline: qdisc is short for ‘queueing discipline’ and it is elementary to understanding traffic control. Whenever the Kernel needs to send a packet to an interface, it is enqueued to the qdisc >configured for that interface. Immediately afterwards, the Kernel tries to get as many packets as possible from the qdisc, for giving them to the network adaptor driver.
Classes: Some qdiscs can contain classes, which contain further qdiscs,traffic may then be enqueued in any of the inner qdiscs, which are within the classes. When the kernel tries to dequeue a >packet from such a classful qdisc it can come from any of the classes. A qdisc may for example prioritize certain kinds of traffic by trying to dequeue from certain classes before others.
Filters: A filter is used by a classful qdisc to determine in which class a packet will be enqueued. Whenever traffic arrives at a class with subclasses, it needs to be classified. Various methods >may be employed to do so, one of these are the filters. All filters attached to the class are called, until one of them returns with a verdict. If no verdict was made, other crit
In essence: classful qdiscs have filters which are used to classify traffic and determine which class a packet should be placed in.
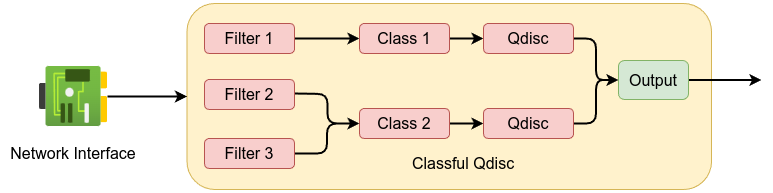
Classless qdiscs are designed to operate as standalone queuing disciplines. classless qdiscs don’t have children or classes which is impossible to attach a filters to it. eBPF filters are intended to work with classful qdiscs where they can classify packets into different classes. You can check which qdisc attached to your network devices is by using ip command or sudo tc qdisc shows the following:
qdisc noqueue 0: dev lo root refcnt 2
qdisc fq_codel 0: dev enp1s0 root refcnt 2 limit 10240p flows 1024 quantum 1514 target 5ms interval 100ms memory_limit 32Mb ecn drop_batch 64
qdisc noqueue on localhost which means no qdisc attached to the localhost which is normal.qdisc fq_codel is attached to the physical interface enp1s0. qdisc fq_codel stands for Fair Queuing Controlled Delay is queuing discipline that classifies data using a stochastic model that it uses a combination of fair queuing and delay control techniques to manage congestion to ensure the fairness of sharing the flow.
limit 10240p this is the queue size and if the limit exceeds this value, packet will start dropping.
flows 1024 this is the number of flow for the incoming packets or the qdisc can track up to 1,024 separate flows.
target 5ms which is the acceptable minimum queue delay.
memory_limit 32Mb sets a limit on the total number of bytes that can be queued in this FQ-CoDel instance.
drop_batch 64 sets the maximum number of packets to drop when limit or memory_limit is exceeded.
Traffic Control has two major components: classifiers and actions. Classifiers are used to inspect packets and decide if they match certain criteria, such as IP addresses, ports or protocols. They essentially sort packets into groups based on rules so that further processing can be applied to the appropriate packets. Actions define what happens to a packet after it has been classified. Once a packet matches a rule, an action is executed on it—such as dropping the packet, changing its priority or redirecting it to another interface.
Traffic control eBPF programs are classified either as BPF_PROG_TYPE_SCHED_CLS with SEC("tc") or BPF_PROG_TYPE_SCHED_ACT with SEC("action/").
BPF_PROG_TYPE_SCHED_CLS is often preferred, as it can function as both a classifier and an action executor when used with the direct-action flag. One key advantage is that these eBPF programs can be attached to both egress (outgoing) and ingress (incoming) traffic. This ability allows administrators to inspect, modify and filter packets in both directions.
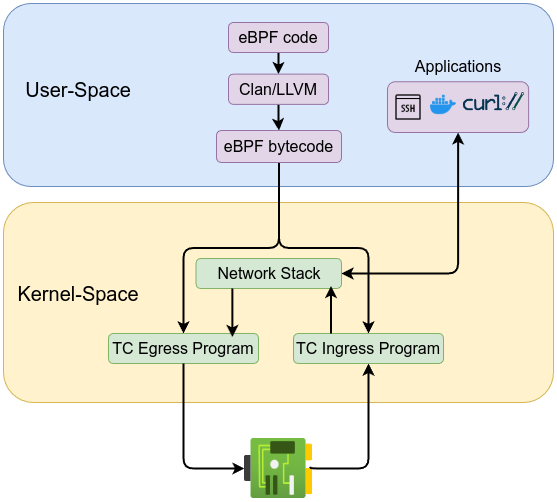
Actions and their corresponding values are defined in include/uapi/linux/pkt_cls.h kernel source code:
#define TC_ACT_UNSPEC (-1)
#define TC_ACT_OK 0
#define TC_ACT_RECLASSIFY 1
#define TC_ACT_SHOT 2
#define TC_ACT_PIPE 3
#define TC_ACT_STOLEN 4
#define TC_ACT_QUEUED 5
#define TC_ACT_REPEAT 6
#define TC_ACT_REDIRECT 7
#define TC_ACT_TRAP 8
Actions and direct-action are defined in this URL which states as the following:
Direct action
When attached in direct action mode, the eBPF program will act as both a classifier and an action. This mode simplifies setups for the most common use cases where we just want to always execute an action. In direct action mode the return value can be one of:
* TC_ACT_UNSPEC (-1) - Signals that the default configured action should be taken.
* TC_ACT_OK (0) - Signals that the packet should proceed.
* TC_ACT_RECLASSIFY (1) - Signals that the packet has to re-start classification from the root qdisc. This is typically used after modifying the packet so its classification might have different results.
* TC_ACT_SHOT (2) - Signals that the packet should be dropped, no other TC processing should happen.
* TC_ACT_PIPE (3) - While defined, this action should not be used and holds no particular meaning for eBPF classifiers.
* TC_ACT_STOLEN (4) - While defined, this action should not be used and holds no particular meaning for eBPF classifiers.
* TC_ACT_QUEUED (5) - While defined, this action should not be used and holds no particular meaning for eBPF classifiers.
* TC_ACT_REPEAT (6) - While defined, this action should not be used and holds no particular meaning for eBPF classifiers.
* TC_ACT_REDIRECT (7) - Signals that the packet should be redirected, the details of how and where to are set as side effects by helpers functions.
Now, let’s look at an example to fully understand the concepts discussed above. In the next example, we use BPF_PROG_TYPE_SCHED_CLS program but will allow us to take actions based on out classification using direct-action later. The code checks for packets on egress with port 8080 and drops them and send a message with bpf_printk.
#include <linux/bpf.h>
#include <linux/if_ether.h>
#include <linux/ip.h>
#include <linux/tcp.h>
#include <bpf/bpf_helpers.h>
#include <bpf/bpf_endian.h>
#include <linux/in.h>
#include <linux/pkt_cls.h>
char _license[] SEC("license") = "GPL";
SEC("tc")
int drop_egress_port_8080(struct __sk_buff *skb) {
void *data = (void *)(long)skb->data;
void *data_end = (void *)(long)skb->data_end;
struct ethhdr *eth = data;
if ((void *)eth + sizeof(*eth) > data_end)
return TC_ACT_OK;
if (bpf_ntohs(eth->h_proto) != ETH_P_IP)
return TC_ACT_OK;
struct iphdr *iph = data + sizeof(*eth);
if ((void *)iph + sizeof(*iph) > data_end)
return TC_ACT_OK;
if (iph->protocol != IPPROTO_TCP)
return TC_ACT_OK;
int ip_header_length = iph->ihl * 4;
struct tcphdr *tcph = data + sizeof(*eth) + ip_header_length;
if ((void *)tcph + sizeof(*tcph) > data_end)
return TC_ACT_OK;
if (bpf_ntohs(tcph->dest) == 8080) {
bpf_printk("Dropping egress packet to port 8080\n");
return TC_ACT_SHOT;
}
return TC_ACT_OK;
}
As shown in the previous code, the program performs a chain of checks. For packets that are not of interest, it returns TC_ACT_OK, allowing them to proceed. However, if the final check detects that the destination port is 8080, it returns TC_ACT_SHOT, which means the packet should be dropped.
TC_ACT_OK, it signals that the packet should continue its normal processing in the networking stack, effectively “exiting” our code without any special intervention like dropping or redirecting it.
Compile the code using LLVM/clang, then add the clsact qdisc, which enables hooking eBPF programs for both ingress (incoming) and egress (outgoing) traffic sudo tc qdisc add dev qdisc clsact
Next, attach the object file to the egress traffic with the direct-action flag: sudo tc filter add dev enp1s0 egress bpf direct-action obj tc_drop_egress.o sec tc. On a separate machine, start a web server on port 8080 using python3 -m http.server 8080. Back to the eBPF machine, executing a curl command curl http://192.168.1.6:8080/ you will notice that traffic is being dropped and you can see the debug messages using sudo cat /sys/kernel/debug/tracing/trace_pipe or you could use sudo tc exec bpf dbg to show the debug messages, which might look like:
Running! Hang up with ^C!
curl-1636 [003] b..1. 1735.290483: bpf_trace_printk: Dropping egress packet to port 8080
<idle>-0 [003] b.s3. 1736.321969: bpf_trace_printk: Dropping egress packet to port 8080
<idle>-0 [001] b.s3. 1736.834411: bpf_trace_printk: Dropping egress packet to port 8080
<idle>-0 [003] b.s3. 1737.346341: bpf_trace_printk: Dropping egress packet to port 8080
<idle>-0 [003] b.s3. 1737.858194: bpf_trace_printk: Dropping egress packet to port 8080
<idle>-0 [003] b.s3. 1738.370403: bpf_trace_printk: Dropping egress packet to port 8080
The attachment can be stopped by deleting the qdisc using sudo tc qdisc del dev enp1s0 clsact. I hope that Traffic Control is much clearer at this point.
If we want to set up a sensor to analyze traffic from a specific service or port, all we need to do is redirect that traffic using the bpf_clone_redirect helper function to a predefined interface for tapping. The cloning will allow us to monitor traffic with actively interfering or impacting performance. The redirected traffic can then be forwarded to traffic analysis tools such as Security Onion, Suricata, Snort, zeek, …etc. The bpf_clone_redirect helper function clones the packet and then redirects the clone to another interface, while the bpf_redirect helper function redirects the packet without cloning it. Both helper functions require the target interface’s ifindex, which represents the interface ID. bpf_clone_redirect helper function has a prototype as the following:
static long (* const bpf_clone_redirect)(struct __sk_buff *skb, __u32 ifindex, __u64 flags) = (void *) 13;
Cloning traffic not just for IPS/IDS , it can be also used to keep full packet capture (FPC) for later to be used in incident analysis or compromise assessment.
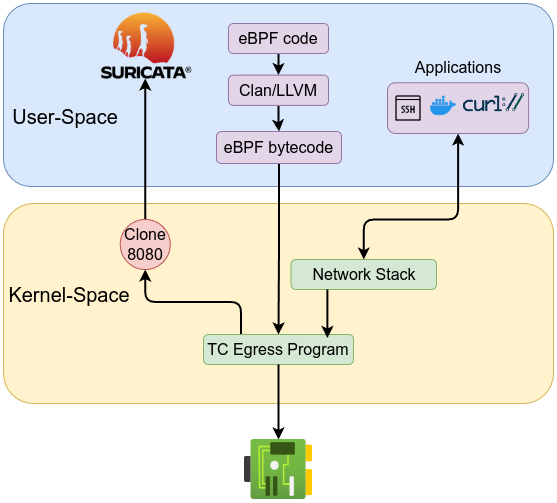
First, let’s setup the interface by creating dummy interface sudo ip link add dummy0 type dummy, then bring the interface up using sudo ip link set dummy0 up, then verify the interface ip link show dummy0 which gives similar to the following:
4: dummy0: <BROADCAST,NOARP,UP,LOWER_UP> mtu 1500 qdisc noqueue state UNKNOWN mode DEFAULT group default qlen 1000
link/ether 16:aa:51:3c:b7:7b brd ff:ff:ff:ff:ff:ff
The interface ID is 4. Now let’s modify the previous code to allow the traffic on port 8080 while cloning it to the dummy interface with ID 4.
#include <linux/bpf.h>
#include <linux/if_ether.h>
#include <linux/ip.h>
#include <linux/tcp.h>
#include <bpf/bpf_helpers.h>
#include <bpf/bpf_endian.h>
#include <linux/in.h>
#include <linux/pkt_cls.h>
char _license[] SEC("license") = "GPL";
SEC("tc")
int clone_egress_port_8080(struct __sk_buff *skb) {
void *data = (void *)(long)skb->data;
void *data_end = (void *)(long)skb->data_end;
struct ethhdr *eth = data;
if ((void *)eth + sizeof(*eth) > data_end)
return TC_ACT_OK;
if (bpf_ntohs(eth->h_proto) != ETH_P_IP)
return TC_ACT_OK;
struct iphdr *iph = data + sizeof(*eth);
if ((void *)iph + sizeof(*iph) > data_end)
return TC_ACT_OK;
if (iph->protocol != IPPROTO_TCP)
return TC_ACT_OK;
int ip_header_length = iph->ihl * 4;
struct tcphdr *tcph = data + sizeof(*eth) + ip_header_length;
if ((void *)tcph + sizeof(*tcph) > data_end)
return TC_ACT_OK;
if (bpf_ntohs(tcph->dest) == 8080) {
int target_ifindex = 4;
bpf_printk("Cloning packet to ifindex %d and allowing original packet\n", target_ifindex);
bpf_clone_redirect(skb, target_ifindex, 0);
return TC_ACT_OK;
}
return TC_ACT_OK;
}
Compile and attach the eBPF program then setup a web server as we did in the previous example. Next, start capturing the traffic on the dummy interface using sudo tcpdump -i dummy0 then curl http://192.168.1.6:8080/index.html You should see tcpdump output similar to the following:
tcpdump: verbose output suppressed, use -v[v]... for full protocol decode
listening on dummy0, link-type EN10MB (Ethernet), snapshot length 262144 bytes
23:12:53.941290 IP debian.58768 > client-Standard-PC-Q35-ICH9-2009.http-alt: Flags [S], seq 1415486505, win 64240, options [mss 1460,sackOK,TS val 3409122040 ecr 0,nop,wscale 7], length 0
23:12:53.941711 IP debian.58768 > client-Standard-PC-Q35-ICH9-2009.http-alt: Flags [.], ack 1257763673, win 502, options [nop,nop,TS val 3409122040 ecr 2981277197], length 0
23:12:53.941792 IP debian.58768 > client-Standard-PC-Q35-ICH9-2009.http-alt: Flags [P.], seq 0:93, ack 1, win 502, options [nop,nop,TS val 3409122040 ecr 2981277197], length 93: HTTP: GET /index.html HTTP/1.1
23:12:53.942842 IP debian.58768 > client-Standard-PC-Q35-ICH9-2009.http-alt: Flags [.], ack 185, win 501, options [nop,nop,TS val 3409122041 ecr 2981277198], length 0
23:12:53.942980 IP debian.58768 > client-Standard-PC-Q35-ICH9-2009.http-alt: Flags [F.], seq 93, ack 188, win 501, options [nop,nop,TS val 3409122041 ecr 2981277198], length 0
The traffic captured on the dummy interface can then be analyzed by Suricata or any other network analysis and monitoring tool. The cloned traffic can also be sent to another NIC to be sent out to a sensor machine such as Security Onion server (forward nodes).
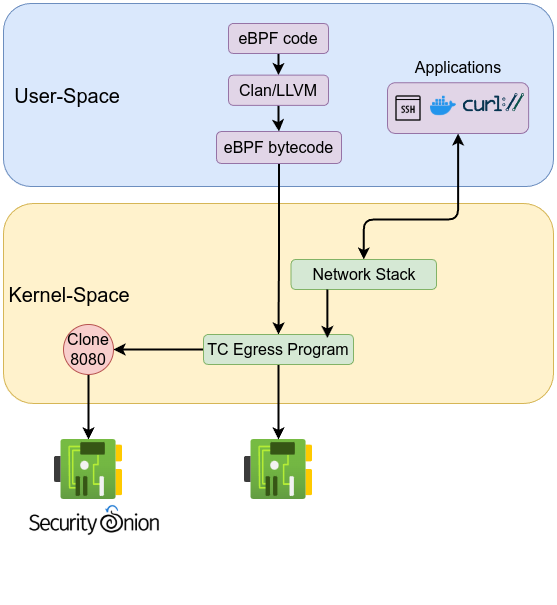
The next example demonstrates one of the capabilities of traffic control—manipulating traffic. In this example, the program will change the first 4 bytes of an HTTP response (initiated from port 8080) to ‘XXXX’. This means that instead of seeing ‘HTTP/1.0’, you would see ‘XXXX/1.0’.
The steps are as follows:
bpf_skb_store_bytes helper function.bpf_l4_csum_replace helper function.bpf_skb_store_bytes helper function has the following prototype:
static long (* const bpf_skb_store_bytes)(struct __sk_buff *skb, __u32 offset, const void *from, __u32 len, __u64 flags) = (void *) 9;
While bpf_l4_csum_replace helper function has the following prototype:
static long (* const bpf_l4_csum_replace)(struct __sk_buff *skb, __u32 offset, __u64 from, __u64 to, __u64 flags) = (void *) 11;
#include <linux/bpf.h>
#include <linux/if_ether.h>
#include <linux/ip.h>
#include <linux/tcp.h>
#include <linux/in.h>
#include <linux/pkt_cls.h>
#include <bpf/bpf_helpers.h>
#include <bpf/bpf_endian.h>
char _license[] SEC("license") = "GPL";
SEC("tc")
int modify_http_response(struct __sk_buff *skb) {
void *data = (void *)(long)skb->data;
void *data_end = (void *)(long)skb->data_end;
struct ethhdr *eth = data;
if ((void *)eth + sizeof(*eth) > data_end)
return TC_ACT_OK;
if (bpf_ntohs(eth->h_proto) != ETH_P_IP)
return TC_ACT_OK;
struct iphdr *iph = data + sizeof(*eth);
if ((void *)iph + sizeof(*iph) > data_end)
return TC_ACT_OK;
if (iph->protocol != IPPROTO_TCP)
return TC_ACT_OK;
int ip_hdr_len = iph->ihl * 4;
struct tcphdr *tcph = data + sizeof(*eth) + ip_hdr_len;
if ((void *)tcph + sizeof(*tcph) > data_end)
return TC_ACT_OK;
if (bpf_ntohs(tcph->source) != 8080)
return TC_ACT_OK;
int tcp_hdr_len = tcph->doff * 4;
void *payload = (void *)tcph + tcp_hdr_len;
if (payload + 4 > data_end) // ensure there are at least 4 bytes in the payload
return TC_ACT_OK;
char orig_val[4];
if (bpf_skb_load_bytes(skb, (payload - data), orig_val, 4) < 0)
return TC_ACT_OK;
if (orig_val[0] == 'H' && orig_val[1] == 'T' && orig_val[2] == 'T' && orig_val[3] == 'P') {
char new_val[4] = {'X', 'X', 'X', 'X'};
if (bpf_skb_store_bytes(skb, (payload - data), new_val, 4, 0) < 0)
return TC_ACT_OK;
int tcp_csum_offset = ((void *)tcph - data) + offsetof(struct tcphdr, check);
bpf_l4_csum_replace(skb, tcp_csum_offset, *((__u32 *)orig_val), *((__u64 *)new_val), 4);
bpf_printk("Modified HTTP response header from 'HTTP' to 'XXXX'\n");
}
return TC_ACT_OK;
}
Compile the code and attach it on ingress traffic using sudo tc filter add dev enp1s0 ingress bpf direct-action obj modify_http_response.o sec tc.
Next, setup a web server on another machine. Then, from the eBPF machine, execute the following:
nc 192.168.1.6 8080
GET /index.html HTTP/1.1
Host: 192.168.1.6:8080
The output should look similar to the following:
GET /index.html HTTP/1.1
Host: 192.168.1.6:8080
XXXX/1.0 404 File not found
Server: SimpleHTTP/0.6 Python/3.12.3
Date: Thu, 06 Mar 2025 05:13:32 GMT
Connection: close
Content-Type: text/html;charset=utf-8
Content-Length: 335
HTTP/1.0 404 File not found is now replaced with XXXX/1.0 404 File not found.
Next, we will talk about XDP (Express Data Path), where XDP programs are executed before packets reach the kernel network stack.
XDP (eXpress Data Path) is a high-performance packet processing framework integrated directly into the Linux kernel. It leverages eBPF (extended Berkeley Packet Filter) technology to enable customizable packet processing at the earliest possible stage when packets arrive at the network driver (ingress traffic) before the kernel allocates an sk_buff for them. By operating before the kernel’s traditional networking stack processes packets, XDP dramatically reduces latency, improves throughput, and minimizes processing overhead. One of the core reasons XDP achieves such high efficiency is by avoiding traditional kernel operations, such as allocation of the socket buffer structure (sk_buff) or generic receive offload (GRO), which are expensive and unnecessary at this early stage. Unlike traditional Linux networking, XDP does not require packets to be wrapped into the kernel’s socket buffer (sk_buff). The sk_buff structure, while powerful and flexible, is relatively heavyweight and incurs significant performance costs because of the extensive metadata and management overhead it introduces. By bypassing the sk_buff, XDP can directly manipulate raw packet data significantly boosting packet processing performance. Additionally, XDP provides the capability for atomic runtime updates to its programs, offering significant operational flexibility without traffic disruption.
Each packet processed by XDP is represented by a special context structure called xdp_buff. The primary difference between the xdp_buff and traditional sk_buff is related to the processing stage and the complexity of these structures. The xdp_buff is significantly simpler and is employed much earlier in the packet-processing pipeline. XDP programs are classified as BPF_PROG_TYPE_XDP and it used xdp_buff structure which is defined in include/net/xdp.h as the following:
struct xdp_buff {
void *data;
void *data_end;
void *data_meta;
void *data_hard_start;
struct xdp_rxq_info *rxq;
struct xdp_txq_info *txq;
u32 frame_sz;
u32 flags;
};
XDP operates in three distinct modes that suit different scenarios: native XDP, offloaded XDP and generic XDP.
Native XDP is the default and most performant mode, running directly within network driver. It delivers optimal efficiency and minimal latency, supported broadly across modern NICs. Offloaded XDP leverages specialized hardware (SmartNICs) by executing XDP programs directly on NIC hardware, freeing CPU resources and pushing performance even higher, ideal for demanding high-throughput scenarios. Generic XDP is available when native support isn’t present. It executes within the kernel’s networking stack rather than the NIC driver, primarily useful for development and testing but provides lower performance due to the additional overhead.
An XDP program uses return codes which are defined in include/uapi/linux/bpf.h header file as the following:
enum xdp_action {
XDP_ABORTED = 0,
XDP_DROP,
XDP_PASS,
XDP_TX,
XDP_REDIRECT,
};
These return codes are used to instruct the network driver on how to handle incoming packets. The return codes are as follows:
XDP_DROP: Immediately drops packets at the NIC driver, ideal for quick, resource-efficient firewalling and DDoS mitigation.XDP_PASS: Forwards the packet to the kernel’s regular network stack.XDP_TX: Sends the packet back out of the same NIC it arrived on, often used in load balancing and packet rewriting scenarios.XDP_REDIRECT: Sends the packet out through a different NIC or redirects it to a different processing CPU.XDP_ABORTED: Signifies an error condition, useful during debugging and development.The following diagram shows the basic XDP workflow:
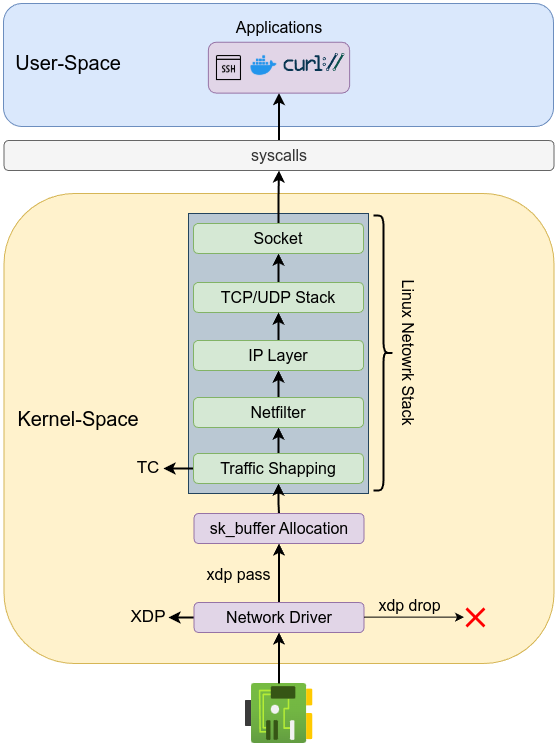
One common use case of XDP is DDoS mitigation, where it quickly identifies and drops malicious traffic with minimal processing overhead. XDP is also heavily used for advanced packet forwarding and load balancing, enabling quick header modifications and packet routing decisions directly at the driver level. Network analytics and sampling are other powerful XDP applications, where packet data can be efficiently captured and transmitted to user-space applications through memory-mapped ring buffers. Custom protocol handling, such as encapsulation or decapsulation, is easily achievable with XDP, facilitating efficient interactions with upper-layer network functions such as the GRO engine. Real-world deployments by companies like Facebook (Katran) and Cloudflare have demonstrated substantial performance improvements by integrating XDP for load balancing, firewalling, and DDoS mitigation. For more details please visit Cilium’s documentation.
The next example is explained previously. The following code performs a chain of checks to drop port 8080 on ingress traffic using XDP_DROP. The code uses xdp_md as context instead of sk_buff as previously explained.
#include <linux/bpf.h>
#include <linux/if_ether.h>
#include <linux/ip.h>
#include <linux/tcp.h>
#include <bpf/bpf_helpers.h>
#include <bpf/bpf_endian.h>
#include <linux/in.h>
char _license[] SEC("license") = "GPL";
SEC("xdp")
int drop_ingress_port_8080(struct xdp_md *ctx) {
void *data = (void *)(long)ctx->data;
void *data_end = (void *)(long)ctx->data_end;
struct ethhdr *eth = data;
if ((void *)eth + sizeof(*eth) > data_end)
return XDP_PASS;
if (bpf_ntohs(eth->h_proto) != ETH_P_IP)
return XDP_PASS;
struct iphdr *iph = data + sizeof(*eth);
if ((void *)iph + sizeof(*iph) > data_end)
return XDP_PASS;
if (iph->protocol != IPPROTO_TCP)
return XDP_PASS;
int ip_header_length = iph->ihl * 4;
struct tcphdr *tcph = data + sizeof(*eth) + ip_header_length;
if ((void *)tcph + sizeof(*tcph) > data_end)
return XDP_PASS;
if (bpf_ntohs(tcph->dest) == 8080) {
bpf_printk("Dropping XDP egress packet port 8080\n");
return XDP_DROP;
}
return XDP_PASS;
}
Compile the code using LLVM then load it with: sudo ip link set dev enp1s0 xdp obj xdp_drop_8080.o sec xdp.
xdp obj xdp_drop_8080.o This command loads an XDP program from the ELF object file named xdp_drop_8080.o. By default, the system attempts to use native driver mode if available, falling back to generic mode otherwise. You can also force a specific mode by using one of these options: xdpgeneric: Enforce generic XDP mode.
xdpdrv: Enforce native driver XDP mode. xdpoffload: Enforce offloaded XDP mode for supported hardware. For example,sudo ip link set dev enp1s0 xdpgeneric obj x.o sec xdp will enforce generic XDP mode. To unload the XDP program, run: sudo ip link set dev enp1s0 xdp off.
As we mentioned earlier, XDP can operate as an efficient load balancer. In the following example, we have an ICMP load balancer implemented using a round-robin approach connected to two backend servers. When load balancer receives ICMP echo request will dispatch it to the servers in order. The idea behind this load balancer is that it routes by re-writing the destination IP, delivering each request to the backend servers in sequential.
The IP header checksum must be recalculated, RFC 1071 explaining in details how IP header checksum, but to simplify the process it has two steps: one’s complement addition and folding process. bpf_csum_diff helper function to calculate a checksum difference from the raw buffer pointed by from, of length from_size (that must be a multiple of 4), towards the raw buffer pointed by to, of size to_size (that must be a multiple of 4) and which has the following prototype:
static __s64 (* const bpf_csum_diff)(__be32 *from, __u32 from_size, __be32 *to, __u32 to_size, __wsum seed) = (void *) 28;
In this example, the XPD ICMP load balancer is configured on IP address 192.168.1.2. It has two backend servers: the first backend server has IP address 192.168.1.3 with MAC address 52:54:00:ff:ff:55, and the second backend server has IP address 192.168.1.4 with MAC address 52:54:00:5d:6e:a1. When an ICMP Echo Request reaches the load balancer, it will redirect the first request to the first backend server and the second Echo Request to the second backend server.
#include <linux/bpf.h>
#include <linux/if_ether.h>
#include <linux/ip.h>
#include <linux/in.h>
#include <linux/icmp.h>
#include <bpf/bpf_helpers.h>
#include <bpf/bpf_endian.h>
#define LB_IP __constant_htonl(0xC0A87AEE) /* 192.168.1.2 */
char _license[] SEC("license") = "GPL";
struct backend {
__u32 ip;
unsigned char mac[ETH_ALEN];
};
struct {
__uint(type, BPF_MAP_TYPE_ARRAY);
__uint(max_entries, 1);
__type(key, __u32);
__type(value, __u32);
} rr_map SEC(".maps");
struct {
__uint(type, BPF_MAP_TYPE_ARRAY);
__uint(max_entries, 2);
__type(key, __u32);
__type(value, struct backend);
} backend_map SEC(".maps");
static __always_inline __u16 ip_recalc_csum(struct iphdr *iph)
{
iph->check = 0;
unsigned int csum = bpf_csum_diff(0, 0, (unsigned int *)iph, sizeof(*iph), 0);
for (int i = 0; i < 4; i++) {
if (csum >> 16)
csum = (csum & 0xffff) + (csum >> 16);
}
return ~csum;
}
SEC("xdp")
int icmp_lb(struct xdp_md *ctx)
{
void *data = (void *)(long)ctx->data;
void *data_end = (void *)(long)ctx->data_end;
struct ethhdr *eth = data;
if ((void*)(eth + 1) > data_end)
return XDP_PASS;
if (eth->h_proto != bpf_htons(ETH_P_IP))
return XDP_PASS;
struct iphdr *iph = data + sizeof(*eth);
if ((void*)(iph + 1) > data_end)
return XDP_PASS;
if (iph->daddr != LB_IP)
return XDP_PASS;
if (iph->protocol != IPPROTO_ICMP)
return XDP_PASS;
__u32 bk = 0;
struct backend *b_ptr = bpf_map_lookup_elem(&backend_map, &bk);
if (b_ptr && b_ptr->ip == 0) {
struct backend be0 = {
.ip = __constant_htonl(0xC0A87A58),
.mac = {0x52, 0x54, 0x00, 0xff, 0xff, 0x55}
};
bpf_map_update_elem(&backend_map, &bk, &be0, BPF_ANY);
bk = 1;
struct backend be1 = {
.ip = __constant_htonl(0xC0A87AD7),
.mac = {0x52, 0x54, 0x00, 0x5d, 0x6e, 0xa1}
};
bpf_map_update_elem(&backend_map, &bk, &be1, BPF_ANY);
}
__u32 rr_key = 0;
__u32 *p_index = bpf_map_lookup_elem(&rr_map, &rr_key);
if (!p_index)
return XDP_PASS;
__u32 index = *p_index;
*p_index = (index + 1) % 2;
__u32 backend_key = index;
struct backend *be = bpf_map_lookup_elem(&backend_map, &backend_key);
if (!be)
return XDP_PASS;
iph->daddr = be->ip;
iph->check = ip_recalc_csum(iph);
__builtin_memcpy(eth->h_dest, be->mac, ETH_ALEN);
return XDP_TX;
}
First, structure was define for backends’ IPs unsigned 32-bit integer and MAC addresses with ETH_ALEN of length which is 6 as defined in include/linux/if_ether.h. Second, define a map of type BPF_MAP_TYPE_ARRAY to track the state of our round-robin load balancer with only one entry and key 0 should be initialized to 0. Third, define a map of type BPF_MAP_TYPE_ARRAY to store backends’ IPs and MAC addresses and key 0 should be initialized to 0.
struct backend {
__u32 ip;
unsigned char mac[ETH_ALEN];
};
struct {
__uint(type, BPF_MAP_TYPE_ARRAY);
__uint(max_entries, 1);
__type(key, __u32);
__type(value, __u32);
} rr_map SEC(".maps");
struct {
__uint(type, BPF_MAP_TYPE_ARRAY);
__uint(max_entries, 2);
__type(key, __u32);
__type(value, struct backend);
} backend_map SEC(".maps");
Then, the code performs chain of checks to ensure that the code is only process ICMP packets.
/* Parse Ethernet header */
struct ethhdr *eth = data;
if ((void*)(eth + 1) > data_end)
return XDP_PASS;
if (eth->h_proto != bpf_htons(ETH_P_IP))
return XDP_PASS;
/* Parse IP header */
struct iphdr *iph = data + sizeof(*eth);
if ((void*)(iph + 1) > data_end)
return XDP_PASS;
/* Process only packets destined to LB_IP */
if (iph->daddr != LB_IP)
return XDP_PASS;
/* Process only ICMP packets */
if (iph->protocol != IPPROTO_ICMP)
return XDP_PASS;
Next, the code populates the backend_map with backend information and selects a backend using round-robin from the rr_map.
__u32 bk = 0;
struct backend *b_ptr = bpf_map_lookup_elem(&backend_map, &bk);
if (b_ptr && b_ptr->ip == 0) {
struct backend be0 = {
.ip = __constant_htonl(0xC0A87A58),
.mac = {0x52, 0x54, 0x00, 0xff, 0xff, 0x55}
};
bpf_map_update_elem(&backend_map, &bk, &be0, BPF_ANY);
bk = 1;
struct backend be1 = {
.ip = __constant_htonl(0xC0A87AD7),
.mac = {0x52, 0x54, 0x00, 0x5d, 0x6e, 0xa1}
};
bpf_map_update_elem(&backend_map, &bk, &be1, BPF_ANY);
}
__u32 rr_key = 0;
__u32 *p_index = bpf_map_lookup_elem(&rr_map, &rr_key);
if (!p_index)
return XDP_PASS;
__u32 index = *p_index;
*p_index = (index + 1) % 2;
__u32 backend_key = index;
struct backend *be = bpf_map_lookup_elem(&backend_map, &backend_key);
Then, the code rewrites the destination IP address to the chosen backend from round-robin map followed by the calculation of the IP header checksum using the following:
static __always_inline __u16 ip_recalc_csum(struct iphdr *iph)
{
iph->check = 0;
unsigned int csum = bpf_csum_diff(0, 0, (unsigned int *)iph, sizeof(*iph), 0);
for (int i = 0; i < 4; i++) {
if (csum >> 16)
csum = (csum & 0xffff) + (csum >> 16);
}
return ~csum;
}
In short, the checksum is calculated by summing all the 16-bit words of the header using one’s complement arithmetic. “Folding” means that if the sum exceeds 16 bits, any overflow (carry) from the high-order bits is added back into the lower 16 bits. Finally, the one’s complement (bitwise NOT) of that folded sum gives the checksum.
As we mentioned before,bpf_csum_diff helper function with seed of zero performs one’s complement addition. Next, the folding process which has the following in one of four iteration:
csum >> 16 (discards the lower 4 hex digits) of bpf_csum_diff output is nonzero.bpf_csum_diff using a bitwise AND with 0xFFFF.csum & 0xffff), and store the result in csum.The final step in the code is to set destination MAC address to the chosen backend’s MAC address using__builtin_memcpy. __builtin_memcpy is not a standard C library function; it’s a compiler-provided function that offers optimized memory copying and has the following prototype:
void *__builtin_memcpy(void *dest, const void *src, size_t size);
Compile the code. Then, attach the XDP program to your interface sudo ip link set dev enp1s0 xdp obj icmp_lb.o sec xdp. Next, capture ICMP traffic on both backend using sudo tcpdump -i enp1s0 icmp, then from fourth machine, send Echo request to the load balancer ping 192.168.1.2
PING 192.168.1.2 (192.168.122.238) 56(84) bytes of data.
64 bytes from 192.168.1.3: icmp_seq=1 ttl=64 time=0.442 ms (DIFFERENT ADDRESS!)
64 bytes from 192.168.1.4: icmp_seq=2 ttl=64 time=0.667 ms (DIFFERENT ADDRESS!)
64 bytes from 192.168.1.3: icmp_seq=3 ttl=64 time=0.713 ms (DIFFERENT ADDRESS!)
64 bytes from 192.168.1.4: icmp_seq=4 ttl=64 time=0.670 ms (DIFFERENT ADDRESS!)
64 bytes from 192.168.1.3: icmp_seq=5 ttl=64 time=0.570 ms (DIFFERENT ADDRESS!)
64 bytes from 192.168.1.4: icmp_seq=6 ttl=64 time=0.647 ms (DIFFERENT ADDRESS!)
64 bytes from 192.168.1.3: icmp_seq=7 ttl=64 time=0.715 ms (DIFFERENT ADDRESS!)
64 bytes from 192.168.1.4: icmp_seq=8 ttl=64 time=0.715 ms (DIFFERENT ADDRESS!)
tcpdumpfrom the first backend:
05:14:35.264928 IP _gateway > test1-Standard-PC-Q35-ICH9-2009: ICMP echo request, id 16, seq 1, length 64
05:14:35.264969 IP test1-Standard-PC-Q35-ICH9-2009 > _gateway: ICMP echo reply, id 16, seq 1, length 64
05:14:37.321642 IP _gateway > test1-Standard-PC-Q35-ICH9-2009: ICMP echo request, id 16, seq 3, length 64
05:14:37.321694 IP test1-Standard-PC-Q35-ICH9-2009 > _gateway: ICMP echo reply, id 16, seq 3, length 64
05:14:39.370002 IP _gateway > test1-Standard-PC-Q35-ICH9-2009: ICMP echo request, id 16, seq 5, length 64
05:14:39.370068 IP test1-Standard-PC-Q35-ICH9-2009 > _gateway: ICMP echo reply, id 16, seq 5, length 64
05:14:41.417230 IP _gateway > test1-Standard-PC-Q35-ICH9-2009: ICMP echo request, id 16, seq 7, length 64
05:14:41.417282 IP test1-Standard-PC-Q35-ICH9-2009 > _gateway: ICMP echo reply, id 16, seq 7, length 64
tcpdumpfrom the second backend:
05:14:36.273275 IP _gateway > test2-Standard-PC-Q35-ICH9-2009: ICMP echo request, id 16, seq 2, length 64
05:14:36.273355 IP test2-Standard-PC-Q35-ICH9-2009 > _gateway: ICMP echo reply, id 16, seq 2, length 64
05:14:38.320876 IP _gateway > test2-Standard-PC-Q35-ICH9-2009: ICMP echo request, id 16, seq 4, length 64
05:14:38.320933 IP test2-Standard-PC-Q35-ICH9-2009 > _gateway: ICMP echo reply, id 16, seq 4, length 64
05:14:40.368579 IP _gateway > test2-Standard-PC-Q35-ICH9-2009: ICMP echo request, id 16, seq 6, length 64
05:14:40.368632 IP test2-Standard-PC-Q35-ICH9-2009 > _gateway: ICMP echo reply, id 16, seq 6, length 64
05:14:42.420358 IP _gateway > test2-Standard-PC-Q35-ICH9-2009: ICMP echo request, id 16, seq 8, length 64
05:14:42.420406 IP test2-Standard-PC-Q35-ICH9-2009 > _gateway: ICMP echo reply, id 16, seq 8, length 64
Notice the sequence of ICMP packets: each Echo request is sent to a different backend server. XDP can also be used to extract metadata from packets which can then be sent to network analysis tool for further investigation, stored for logging as a flight record, or used to assist in incident investigation.
The following example extracts metadata of ingress traffic (source IP, source port, destination IP, destination port and protocol) and send the extracted metadata to ring buffer that can be accessed from user space.
#include <linux/bpf.h>
#include <bpf/bpf_helpers.h>
#include <bpf/bpf_endian.h>
#include <linux/if_ether.h>
#include <linux/ip.h>
#include <linux/udp.h>
#include <linux/tcp.h>
#include <linux/in.h>
char _license[] SEC("license") = "GPL";
struct metadata_t {
__u32 src_ip;
__u32 dst_ip;
__u16 src_port;
__u16 dst_port;
__u8 protocol;
};
struct {
__uint(type, BPF_MAP_TYPE_RINGBUF);
__uint(max_entries, 1 << 24);
__uint(map_flags, 0);
} ringbuf SEC(".maps");
SEC("xdp")
int xdp_extract_metadata(struct xdp_md *ctx)
{
void *data_end = (void *)(long)ctx->data_end;
void *data = (void *)(long)ctx->data;
struct ethhdr *eth = data;
if ((void *)(eth + 1) > data_end)
return XDP_PASS;
if (bpf_ntohs(eth->h_proto) != ETH_P_IP)
return XDP_PASS;
struct iphdr *iph = (void *)(eth + 1);
if ((void *)(iph + 1) > data_end)
return XDP_PASS;
__u16 src_port = 0;
__u16 dst_port = 0;
if (iph->protocol == IPPROTO_TCP || iph->protocol == IPPROTO_UDP) {
__u64 ip_header_size = iph->ihl * 4;
__u64 offset = sizeof(*eth) + ip_header_size;
if (offset + sizeof(struct udphdr) > (unsigned long)(data_end - data))
return XDP_PASS;
struct udphdr *uh = data + offset;
if ((void *)(uh + 1) > data_end)
return XDP_PASS;
src_port = uh->source;
dst_port = uh->dest;
}
struct metadata_t *meta = bpf_ringbuf_reserve(&ringbuf, sizeof(*meta), 0);
if (!meta)
return XDP_PASS;
meta->src_ip = iph->saddr;
meta->dst_ip = iph->daddr;
meta->src_port = src_port;
meta->dst_port = dst_port;
meta->protocol = iph->protocol;
bpf_ringbuf_submit(meta, 0);
return XDP_PASS;
}
The code performs chain of checks to extract ports for TCP or UDP, for other protocols, leave ports as 0.
__u16 src_port = 0;
__u16 dst_port = 0;
if (iph->protocol == IPPROTO_TCP || iph->protocol == IPPROTO_UDP) {
__u64 ip_header_size = iph->ihl * 4ULL;
__u64 offset = sizeof(*eth) + ip_header_size;
if (offset + sizeof(struct udphdr) > (unsigned long)(data_end - data))
return XDP_PASS;
struct udphdr *uh = data + offset;
if ((void *)(uh + 1) > data_end)
return XDP_PASS;
src_port = uh->source;
dst_port = uh->dest;
}
Then fill out the metadata event
meta->src_ip = iph->saddr;
meta->dst_ip = iph->daddr;
meta->src_port = src_port;
meta->dst_port = dst_port;
meta->protocol = iph->protocol;
Finally, submit the metadata to the ring buffer. The following user-space program loads the XDP object file, attaches it to the required interface, and retrieves metadata from the ring buffer.
#include <stdio.h>
#include <stdlib.h>
#include <signal.h>
#include <unistd.h>
#include <arpa/inet.h>
#include <string.h>
#include <net/if.h>
#include <errno.h>
#include <linux/if_link.h>
#include <bpf/libbpf.h>
#include <bpf/bpf.h>
#include <netinet/in.h>
#ifndef XDP_FLAGS_DRV
#define XDP_FLAGS_DRV (1U << 0)
#endif
struct metadata_t {
__u32 src_ip;
__u32 dst_ip;
__u16 src_port;
__u16 dst_port;
__u8 protocol;
};
static int handle_event(void *ctx, void *data, size_t data_sz)
{
if (data_sz < sizeof(struct metadata_t)) {
fprintf(stderr, "Ring buffer event too small\n");
return 0;
}
struct metadata_t *md = data;
char src_str[INET_ADDRSTRLEN];
char dst_str[INET_ADDRSTRLEN];
inet_ntop(AF_INET, &md->src_ip, src_str, sizeof(src_str));
inet_ntop(AF_INET, &md->dst_ip, dst_str, sizeof(dst_str));
const char *proto_name;
switch (md->protocol) {
case IPPROTO_TCP:
proto_name = "TCP";
break;
case IPPROTO_UDP:
proto_name = "UDP";
break;
case IPPROTO_ICMP:
proto_name = "ICMP";
break;
default:
proto_name = "UNKNOWN";
break;
}
printf("Packet: %s:%u -> %s:%u, protocol: %s\n",
src_str, ntohs(md->src_port),
dst_str, ntohs(md->dst_port),
proto_name);
return 0;
}
int main(int argc, char **argv)
{
struct bpf_object *obj = NULL;
struct bpf_program *prog = NULL;
struct bpf_map *map = NULL;
struct ring_buffer *rb = NULL;
int prog_fd, map_fd, err, ifindex;
char pin_path[256];
if (argc < 2) {
fprintf(stderr, "Usage: %s <ifname>\n", argv[0]);
return 1;
}
ifindex = if_nametoindex(argv[1]);
if (!ifindex) {
fprintf(stderr, "Invalid interface name: %s\n", argv[1]);
return 1;
}
libbpf_set_strict_mode(LIBBPF_STRICT_ALL);
obj = bpf_object__open_file("xdp_extract_metadata.o", NULL);
if (!obj) {
fprintf(stderr, "ERROR: bpf_object__open_file() failed\n");
return 1;
}
err = bpf_object__load(obj);
if (err) {
fprintf(stderr, "ERROR: bpf_object__load() failed %d\n", err);
goto cleanup;
}
prog = bpf_object__find_program_by_name(obj, "xdp_extract_metadata");
if (!prog) {
fprintf(stderr, "ERROR: couldn't find xdp program in ELF\n");
goto cleanup;
}
prog_fd = bpf_program__fd(prog);
if (prog_fd < 0) {
fprintf(stderr, "ERROR: couldn't get file descriptor for XDP program\n");
goto cleanup;
}
err = bpf_xdp_attach(ifindex, prog_fd, XDP_FLAGS_DRV, NULL);
if (err) {
fprintf(stderr, "ERROR: bpf_xdp_attach(ifindex=%d) failed (err=%d): %s\n",
ifindex, err, strerror(-err));
goto cleanup;
}
printf("Attached XDP program on ifindex %d\n", ifindex);
map = bpf_object__find_map_by_name(obj, "ringbuf");
if (!map) {
fprintf(stderr, "ERROR: couldn't find ringbuf map in ELF\n");
goto cleanup;
}
map_fd = bpf_map__fd(map);
if (map_fd < 0) {
fprintf(stderr, "ERROR: couldn't get ringbuf map fd\n");
goto cleanup;
}
rb = ring_buffer__new(map_fd, handle_event, NULL, NULL);
if (!rb) {
fprintf(stderr, "ERROR: ring_buffer__new() failed\n");
goto cleanup;
}
printf("Listening for events...\n");
while (1) {
err = ring_buffer__poll(rb, 100);
if (err < 0) {
fprintf(stderr, "ERROR: ring_buffer__poll() err=%d\n", err);
break;
}
}
cleanup:
ring_buffer__free(rb);
bpf_xdp_detach(ifindex, XDP_FLAGS_DRV, NULL);
if (obj)
bpf_object__close(obj);
return 0;
}
INET_ADDRSTRLEN is defined in /include/linux/inet.h the kernel source code as 16 bytes which represents the maximum size, in bytes, of a string that can hold an IPv4 address in presentation format. inet_ntop function converts IPv4 and IPv6 addresses from binary to text and it’s a part of standard C library defined in arpa/inet.h and has the following prototype:
const char *inet_ntop(int af, const void *restrict src, char dst[restrict .size], socklen_t size);
AF_INET: Specifies the address family (IPv4).&md->src_ip: A pointer to the binary IPv4 address. src_str: The destination buffer where the converted string will be stored. sizeof(src_str): The size of the destination buffer.
Then the code uses a new approach by opening the object file directly instead of using a skeleton header file. The steps are as follows:
xdp_extract_metadata and load its file descriptor.// Open BPF object file
obj = bpf_object__open_file("xdp_extract_metadata.o", NULL);
if (!obj) {
fprintf(stderr, "ERROR: bpf_object__open_file() failed\n");
return 1;
}
// Load (verify) BPF program
err = bpf_object__load(obj);
if (err) {
fprintf(stderr, "ERROR: bpf_object__load() failed %d\n", err);
goto cleanup;
}
// Find XDP program by name (we used "xdp_extract_metadata")
prog = bpf_object__find_program_by_name(obj, "xdp_extract_metadata");
if (!prog) {
fprintf(stderr, "ERROR: couldn't find xdp program in ELF\n");
goto cleanup;
}
prog_fd = bpf_program__fd(prog);
if (prog_fd < 0) {
fprintf(stderr, "ERROR: couldn't get file descriptor for XDP program\n");
goto cleanup;
}
// Attach the program to the interface (using driver mode as an example)
err = bpf_xdp_attach(ifindex, prog_fd, XDP_FLAGS_DRV, NULL);
if (err) {
fprintf(stderr, "ERROR: bpf_xdp_attach(ifindex=%d) failed (err=%d): %s\n",
ifindex, err, strerror(-err));
goto cleanup;
}
printf("Attached XDP program on ifindex %d\n", ifindex);
// Look up the ringbuf map by name or by index
map = bpf_object__find_map_by_name(obj, "ringbuf");
if (!map) {
fprintf(stderr, "ERROR: couldn't find ringbuf map in ELF\n");
goto cleanup;
}
map_fd = bpf_map__fd(map);
if (map_fd < 0) {
fprintf(stderr, "ERROR: couldn't get ringbuf map fd\n");
goto cleanup;
bpf_xdp_attach is a user-space API function (typically provided by libbpf) that attaches an XDP program to a network interface. defined in tools/lib/bpf/libbpf.h with the following prototype:
int bpf_xdp_attach(int ifindex, int prog_fd, __u32 flags, const struct bpf_xdp_attach_opts *opts);
ifindex: Represents the interface ID and ifindex is obtained by
ifindex = if_nametoindex(argv[1]);
prog_fd: Represents the program file descriptor.
flags: Can take one of three values and they are defined in include/uapi/linux/if_link.h as the following:
#define XDP_FLAGS_SKB_MODE (1U << 1)
#define XDP_FLAGS_DRV_MODE (1U << 2)
#define XDP_FLAGS_HW_MODE (1U << 3)
XDP_FLAGS_SKB_MODE (1U « 1): This flag attaches the XDP program in generic mode.
XDP_FLAGS_DRV_MODE (1U « 2): This flag attaches the XDP program in native driver mode.
XDP_FLAGS_HW_MODE (1U « 3): This flag is used for offloading the XDP program to supported hardware (NICs that support XDP offload).
Finally, the ring buffer is created, and the metadata is then polled from it. Compile the user-space using: clang -o loader loader.c -lbpf. Then, run the code using sudo ./loader enp1s0. Example output:
Attached XDP program on ifindex 2
Listening for events...
Packet: 192.168.1.1:53 -> 192.168.1.2:46313, protocol: UDP
Packet: 192.168.1.1:53 -> 192.168.1.2:46313, protocol: UDP
Packet: 82.65.248.56:123 -> 192.168.1.2:53121, protocol: UDP
Packet: 192.168.1.4:0 -> 192.168.1.2:0, protocol: ICMP
Packet: 192.168.1.4:0 -> 192.168.1.2:0, protocol: ICMP
Packet: 192.168.1.4:0 -> 192.168.1.2:0, protocol: ICMP
Packet: 192.168.1.3:35668 -> 192.168.1.2:22, protocol: TCP
Packet: 192.168.1.3:35668 -> 192.168.1.2:22, protocol: TCP
Packet: 192.168.1.3:35668 -> 192.168.1.2:22, protocol: TCP
Packet: 192.168.1.3:35668 -> 192.168.1.2:22, protocol: TCP
Packet: 192.168.1.3:35668 -> 192.168.1.2:22, protocol: TCP
Packet: 192.168.1.3:35668 -> 192.168.1.2:22, protocol: TCP
Packet: 192.168.1.3:35668 -> 192.168.1.2:22, protocol: TCP
BPF_PROG_TYPE_CGROUP_SOCK_ADDR is a BPF program type designed to attach to control groups (cgroups) and intercept socket address operations, such as connect() calls. It enables administrators to enforce network connection policies—like allowing or blocking connections based on destination IPs and ports—at the cgroup level. This makes it a powerful tool for implementing network security controls within containerized or multi-tenant environments. There are many types of BPF_PROG_TYPE_CGROUP_SOCK_ADDR programs or ELF section such as:
BPF_CGROUP_UDP4_RECVMSG. Programs in this section can intervene in recvmsg() calls on UDP sockets, enabling inspection or filtering of incoming datagrams.BPF_CGROUP_UDP4_SENDMSG. This section lets you apply filters or modifications to sendmsg() calls on UDP sockets, potentially controlling which messages are sent.BPF_PROG_TYPE_CGROUP_SOCK_ADDR programs receive a pointer to a struct bpf_sock_addr as their context. This structure contains the socket’s address information (such as the destination IP and port, along with other details), which the BPF program can inspect or modify during operations like connect() or bind().
struct bpf_sock_addr is defined in include/uapi/linux/bpf.h:
struct bpf_sock_addr {
__u32 user_family;
__u32 user_ip4;
__u32 user_ip6[4];
__u32 user_port;
__u32 family;
__u32 type;
__u32 protocol;
__u32 msg_src_ip4;
__u32 msg_src_ip6[4];
__bpf_md_ptr(struct bpf_sock *, sk);
};
If we have a container connected to the internet without any policy.
BPF_PROG_TYPE_CGROUP_SOCK_ADDR eBPF can be used to make a policy and enforce it. For example, to only port 80 and attach it cgroup associated with that container.

eBPF program:
#include <linux/bpf.h>
#include <linux/in.h>
#include <bpf/bpf_helpers.h>
#include <bpf/bpf_endian.h>
char _license[] SEC("license") = "GPL";
SEC("cgroup/connect4")
int cgroup_connect(struct bpf_sock_addr *ctx)
{
__u16 allowed_port = __bpf_htons(80);
if (ctx->user_port == allowed_port) {
return 1; //===> Allow connection
}
return 0; //===> Block connection
}
User-space code:
#include <stdio.h>
#include <stdlib.h>
#include <fcntl.h>
#include <unistd.h>
#include <bpf/libbpf.h>
#include "cgroup_connect.skel.h"
int main(int argc, char **argv)
{
struct cgroup_connect *skel;
int cgroup_fd;
int err;
if (argc != 2) {
fprintf(stderr, "Usage: %s <cgroup_path>\n", argv[0]);
return EXIT_FAILURE;
}
cgroup_fd = open(argv[1], O_DIRECTORY | O_RDONLY);
if (cgroup_fd < 0) {
perror("Failed to open cgroup");
return EXIT_FAILURE;
}
skel = cgroup_connect__open();
if (!skel) {
fprintf(stderr, "Failed to open BPF skeleton\n");
close(cgroup_fd);
return EXIT_FAILURE;
}
err = cgroup_connect__load(skel);
if (err) {
fprintf(stderr, "Failed to load BPF skeleton: %d\n", err);
cgroup_connect__destroy(skel);
close(cgroup_fd);
return EXIT_FAILURE;
}
skel->links.cgroup_connect = bpf_program__attach_cgroup(skel->progs.cgroup_connect, cgroup_fd);
if (!skel->links.cgroup_connect) {
fprintf(stderr, "Failed to attach BPF program to cgroup\n");
cgroup_connect__destroy(skel);
close(cgroup_fd);
return EXIT_FAILURE;
}
printf("BPF program attached successfully to cgroup: %s\n", argv[1]);
while (1)
sleep(1);
cgroup_connect__destroy(skel);
close(cgroup_fd);
return EXIT_SUCCESS;
}
We have a container with name test.
docker ps
CONTAINER ID IMAGE COMMAND CREATED STATUS PORTS NAMES
34ca63d499df debian:latest "/bin/bash" About an hour ago Up About an hour test
The container PID can be obtained using docker inspect -f '{{.State.Pid}}' test. Let’s get cgroup associated with that container using
cat /proc/3283/cgroup
0::/system.slice/docker-34ca63d499df1071c9d0512aafe7f4a1e73464edc6b40a9b97fdd087542d1930.scope
Then, we can link our eBPF program to our container using:
sudo ./loader /sys/fs/cgroup/system.slice/docker-34ca63d499df1071c9d0512aafe7f4a1e73464edc6b40a9b97fdd087542d1930.scope
The link can be tested to make sure that the policy is applied on our container. From inside our container
curl http://172.17.0.1:8080
curl: (7) Failed to connect to 172.17.0.1 port 8080 after 0 ms: Couldn't connect to server
In this chapter, we explored various networking capabilities in eBPF. We began with socket filter programs, demonstrating how they can detect specific traffic patterns and extract particular strings from network traffic—capabilities that are useful in security applications such as intrusion detection. Next, we examined Traffic Control (TC), which can manage both egress and ingress traffic, and we experimented with its features for firewalling and traffic manipulation. We then discussed Lightweight Tunnel applications, which can also serve as firewalls for tunneled traffic. Then, we explored XDP, which operates on ingress traffic, and tested its potential for firewalling, load balancing, and extracting packet metadata for analysis or logging. Finally, we discussed control group socket address, allows us to apply policies on a cgroup as we did earlier by attaching policies to a container’s cgroup. In the next chapter, we will dive deeper into eBPF security, exploring advanced techniques and strategies for enhancing system protection and monitoring using eBPF.
Seccomp, short for Secure Computing Mode, is a powerful kernel feature that limits the system calls a process can make, thereby reducing the exposed kernel surface and mitigating potential attacks. Seccomp is a security facility in the Linux kernel designed to be a tool for sandboxing processes by restricting the set of system calls they can use. to minimizes the kernel’s exposed interface, allowing developers to reduce the risk of kernel-level exploits. The filtering mechanism is implemented using Berkeley Packet Filter (cBPF) programs which inspect system call numbers and arguments before the system call is executed.
User-space security agents are vulnerable to TOCTOU attacks, tampering, and resource exhaustion because they depend on kernel communication to make security decisions. Seccomp addresses these issues by moving filtering into the kernel. Using a cBPF program, seccomp evaluates system call metadata atomically, eliminating the window for TOCTOU exploits and preventing tampering—since filters, once installed, become immutable and are inherited by child processes. This kernel-level enforcement ensures robust protection even if the user-space agent is compromised. Seccomp filtering is implemented as follows:
The prctl system call is used to control specific characteristics of the calling process and will be explained shortly. Using Seccomp in an application, developers typically follow these steps:
struct seccomp_data which is defined in the kernel source code include/uapi/linux/seccomp.h which provides the metadata needed to evaluate each system call. This structure is defined as follows:/**
* struct seccomp_data - the format the BPF program executes over.
* @nr: the system call number
* @arch: indicates system call convention as an AUDIT_ARCH_* value
* as defined in <linux/audit.h>.
* @instruction_pointer: at the time of the system call.
* @args: up to 6 system call arguments always stored as 64-bit values
* regardless of the architecture.
*/
struct seccomp_data {
int nr;
__u32 arch;
__u64 instruction_pointer;
__u64 args[6];
};
prctl(PR_SET_NO_NEW_PRIVS, 1);
prctl with PR_SET_SECCOMP to Install or activate seccomp filtering with a BPF program:prctl(PR_SET_SECCOMP, SECCOMP_MODE_FILTER, &prog);
Here, prog is a pointer to a struct sock_fprog (defined in include/uapi/linux/filter.h) containing the BPF filter.
When a system call is intercepted, the BPF program returns one of several possible values. Each return value directs the kernel on how to handle the intercepted call. The actions are prioritized, meaning that if multiple filters are in place, the one with the highest precedence takes effect. The primary return values are:
SECCOMP_RET_KILL_PROCESS: Immediately terminates the entire process. The exit status indicates a SIGSYS signal.SECCOMP_RET_KILL_THREAD: Terminates only the current thread, again with a SIGSYS signal.SECCOMP_RET_TRAP: Sends a SIGSYS signal to the process, allowing the kernel to pass metadata about the blocked call (like the system call number and address) to a signal handler.SECCOMP_RET_ERRNO: Prevents execution of the system call and returns a predefined errno to the calling process.SECCOMP_RET_USER_NOTIF: Routes the system call to a user space notification handler, allowing external processes (like container managers) to decide how to handle the call.SECCOMP_RET_TRACE: If a tracer is attached (via ptrace), the tracer is notified, giving it an opportunity to modify or skip the system call.SECCOMP_RET_LOG: Logs the system call, then allows its execution. This is useful for development and debugging.SECCOMP_RET_ALLOW: Simply allows the system call to execute.Seccomp return values are defined in include/linux/seccomp.h Kernel source code as the following:
#define SECCOMP_RET_KILL_PROCESS 0x80000000U /* kill the process */
#define SECCOMP_RET_KILL_THREAD 0x00000000U /* kill the thread */
#define SECCOMP_RET_KILL SECCOMP_RET_KILL_THREAD
#define SECCOMP_RET_TRAP 0x00030000U /* disallow and force a SIGSYS */
#define SECCOMP_RET_ERRNO 0x00050000U /* returns an errno */
#define SECCOMP_RET_USER_NOTIF 0x7fc00000U /* notifies userspace */
#define SECCOMP_RET_TRACE 0x7ff00000U /* pass to a tracer or disallow */
#define SECCOMP_RET_LOG 0x7ffc0000U /* allow after logging */
#define SECCOMP_RET_ALLOW 0x7fff0000U /* allow */
Seccomp filters consist of a set of BPF macros. We will explain the most used ones:
BPF_STMT (code, k): A macro used to define a basic cBPF instruction that does not involve conditional branching. The code parameter specifies the operation, and k is an immediate constant value used by the instruction.BPF_JUMP (code, k, jt, jf): A macro to define a conditional jump instruction.BPF_LD: This flag indicates a load instruction, which reads data into the accumulator.BPF_W: Specifies that the data to load is a word (typically 32 bits).BPF_ABS: Instructs the load operation to use absolute addressing—that is, load data from a fixed offset within the data structure (in this case, the seccomp_data structure).BPF_K: Denotes that the operand (k) is an immediate constant.BPF_JMP: Indicates that the instruction is a jump (conditional or unconditional) type.BPF_JEQ: A condition flag used with jump instructions that causes a jump if the accumulator equals the constant k.Let’s explore a simplified C code example demonstrating how to set up a seccomp filter to block socket syscall to prevent a process from initiating new network connections.
#include <stdio.h>
#include <stdlib.h>
#include <unistd.h>
#include <stddef.h>
#include <sys/prctl.h>
#include <linux/seccomp.h>
#include <linux/filter.h>
#include <errno.h>
#define SYSCALL_SOCKET 41 // syscall number for socket
struct sock_filter filter[] = {
BPF_STMT(BPF_LD | BPF_W | BPF_ABS, offsetof(struct seccomp_data, nr)),
BPF_JUMP(BPF_JMP | BPF_JEQ | BPF_K, SYSCALL_SOCKET, 0, 1),
BPF_STMT(BPF_RET | BPF_K, SECCOMP_RET_ERRNO | (EPERM & SECCOMP_RET_DATA)),
BPF_STMT(BPF_RET | BPF_K, SECCOMP_RET_ALLOW),
};
struct sock_fprog prog = {
.len = (unsigned short)(sizeof(filter) / sizeof(filter[0])),
.filter = filter,
};
int main(int argc, char *argv[]) {
if (argc < 2) {
fprintf(stderr, "Usage: %s <binary> [args...]\n", argv[0]);
exit(EXIT_FAILURE);
}
if (prctl(PR_SET_NO_NEW_PRIVS, 1, 0, 0, 0)) {
perror("prctl(PR_SET_NO_NEW_PRIVS) failed");
exit(EXIT_FAILURE);
}
if (prctl(PR_SET_SECCOMP, SECCOMP_MODE_FILTER, &prog)) {
perror("prctl(PR_SET_SECCOMP) failed");
exit(EXIT_FAILURE);
}
printf("Seccomp filter installed. Attempting socket on %s...\n", argv[1]);
execve(argv[1], &argv[1], NULL);
perror("socket");
return EXIT_FAILURE;
}
Seccomp filter is written using cBPF macros and defines a simple seccomp policy to block the socket system call. First, loads the system call number (from the nr field of the seccomp_data structure) into the accumulator
BPF_STMT(BPF_LD | BPF_W | BPF_ABS, offsetof(struct seccomp_data, nr)),
BPF_LD: Instructs the program to load data.BPF_W: Specifies that a 32-bit word should be loaded.BPF_ABS: Indicates that the data is located at an absolute offset from the beginning of the seccomp_data structure.offsetof(struct seccomp_data, nr): Computes the offset of the nr field (which holds the system call number) within the seccomp_data structure.Second, compare the syscall Number with socket. If the syscall is socket, the next instruction (which blocks the syscall) is executed. Otherwise, the filter skips over the block action and moves on.
BPF_JUMP(BPF_JMP | BPF_JEQ | BPF_K, SYSCALL_SOCKET, 0, 1),
BPF_JMP: Specifies that this is a jump instruction.BPF_JEQ: Adds the condition “jump if equal” to the operation.BPF_K: Indicates that the comparison value is an immediate constant.SYSCALL_SOCKET: The constant to compare against (i.e., the syscall number for socket).
0: If the condition is true (the syscall number equals SYSCALL_SOCKET), do not skip any instructions (i.e., continue with the next instruction).1: If the condition is false (the syscall number does not equal SYSCALL_SOCKET), skip one instruction.Third, Block the socket() syscall and return error code (e.g., EPERM).
BPF_STMT(BPF_RET | BPF_K, SECCOMP_RET_ERRNO | (EPERM & SECCOMP_RET_DATA)),
BPF_RET: Instructs the program to return a value immediately, effectively terminating the BPF program’s evaluation for this syscall.BPF_K: Indicates that the return value is given as an immediate constant.Return Value: SECCOMP_RET_ERRNO | (EPERM & SECCOMP_RET_DATA)EPERM), meaning “Operation not permitted.”Fourth, If the syscall was not socket, this instruction permits it.
BPF_STMT(BPF_RET | BPF_K, SECCOMP_RET_ALLOW),
BPF_RET | BPF_K: Again, a return instruction with a constant.Return Value: SECCOMP_RET_ALLOW. This instructs the kernel to allow the syscall to proceed.Then, ensure that the process or its children cannot gain elevated privileges after the filter is installed
prctl(PR_SET_NO_NEW_PRIVS, 1, 0, 0, 0)
PR_SET_NO_NEW_PRIVS:This option tells the kernel to set a flag that prevents the process or its children from gaining new privileges. Finally, installing the seccomp filter.
prctl(PR_SET_SECCOMP, SECCOMP_MODE_FILTER, &prog)
Compile the code using clang -g -O2 seccomp_socket.c -o seccomp_socket, then chmod +x seccomp_socket. Next, run the code against ssh similar to the following: ./seccomp_socket /usr/bin/ssh [email protected]
Seccomp filter installed. Attempting socket on /usr/bin/ssh...
socket: Operation not permitted
ssh: connect to host 192.168.1.3 port 22: failure
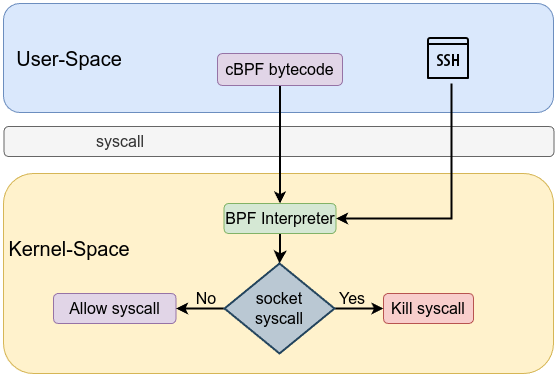
We can see what is happening under the hood using strace ./seccomp_socket /usr/bin/ssh [email protected]
[...]
newfstatat(AT_FDCWD, "/etc/nsswitch.conf", {st_mode=S_IFREG|0644, st_size=569, ...}, 0) = 0
openat(AT_FDCWD, "/etc/passwd", O_RDONLY|O_CLOEXEC) = 3
fstat(3, {st_mode=S_IFREG|0644, st_size=2232, ...}) = 0
lseek(3, 0, SEEK_SET) = 0
read(3, "root:x:0:0:root:/root:/bin/bash\n"..., 4096) = 2232
close(3) = 0
socket(AF_INET, SOCK_STREAM, IPPROTO_TCP) = -1 EPERM (Operation not permitted)
getpid() = 2169
write(2, "socket: Operation not permitted\r"..., 33socket: Operation not permitted
) = 33
getpid() = 2169
write(2, "ssh: connect to host 192.168.1.3"..., 51ssh: connect to host 192.168.1.3 port 22: failure
[...]
Executing socket syscall is being blocked and a return value is showing -1 EPERM (Operation not permitted), which confirms that the filter is working as intended.
/include/linux/syscalls.h in the Linux kernel source code contains the prototypes for all system calls, providing the necessary declarations for the syscall interfaces. Additionally, for the x86_64 architecture, the file arch/x86/entry/syscalls/syscall_64.tbl lists all the system calls along with their corresponding syscall IDs, which are used to generate the syscall dispatch table during the kernel build process.
In the previous example we took blacklist approach by denying socket syscall for example. If we want to take the whitelist approach for a specific binary all we have to do is to record all its syscalls using something like strace. Let’s explore the whitelist approach, the following code has a menu with list of options such as running command ls which uses execve syscall , or opening /etc/passwd which uses open syscall and write syscall.
#include <stdio.h>
#include <stdlib.h>
#include <unistd.h>
#include <sys/syscall.h>
#include <fcntl.h>
#include <string.h>
#include <errno.h>
int main(void) {
int choice;
while (1) {
printf("\nSyscall Menu:\n");
printf("1. Execve /usr/bin/ls\n");
printf("2. Open /etc/passwd\n");
printf("3. Write a message to stdout\n");
printf("4. Exit\n");
printf("Enter your choice: ");
if (scanf("%d", &choice) != 1) {
fprintf(stderr, "Invalid input.\n");
int c;
while ((c = getchar()) != '\n' && c != EOF);
continue;
}
getchar();
switch (choice) {
case 1: {
char *argv[] = { "ls", NULL };
char *envp[] = { NULL };
printf("Executing /usr/bin/ls via execve syscall...\n");
if (syscall(SYS_execve, "/usr/bin/ls", argv, envp) == -1) {
perror("execve syscall failed");
}
break;
}
case 2: {
printf("Opening /etc/passwd via open syscall...\n");
int fd = syscall(SYS_open, "/etc/passwd", O_RDONLY);
if (fd == -1) {
perror("open syscall failed");
} else {
printf("File /etc/passwd opened successfully (fd = %d).\n", fd);
if (syscall(SYS_close, fd) == -1) {
perror("close syscall failed");
}
}
exit(0);
}
case 3: {
const char *msg = "Hello from syscall write!\n";
printf("Writing message to stdout via write syscall...\n");
if (syscall(SYS_write, STDOUT_FILENO, msg, strlen(msg)) == -1) {
perror("write syscall failed");
}
exit(0);
}
case 4: {
printf("Exiting via exit_group syscall...\n");
syscall(SYS_exit_group, 0);
exit(0);
}
default:
printf("Invalid choice. Please select a number between 1 and 5.\n");
}
}
return 0;
}
Let’s compile it using gcc -O2 -Wall syscalls.c -o syscalls. Recording syscall can be done using strace. For example, we want to record write option in our code.
strace -c -f ./syscalls , then choose option 3:
Syscall Menu:
1. Execve /usr/bin/ls
2. Open /etc/passwd
3. Write a message to stdout
4. Exit
Enter your choice: 3
Writing message to stdout via write syscall...
Hello from syscall write!
The strace would look like this:
% time seconds usecs/call calls errors syscall
------ ----------- ----------- --------- --------- ----------------
0.00 0.000000 0 2 read
0.00 0.000000 0 9 write
0.00 0.000000 0 2 close
0.00 0.000000 0 4 fstat
0.00 0.000000 0 8 mmap
0.00 0.000000 0 3 mprotect
0.00 0.000000 0 1 munmap
0.00 0.000000 0 3 brk
0.00 0.000000 0 2 pread64
0.00 0.000000 0 1 1 access
0.00 0.000000 0 1 execve
0.00 0.000000 0 1 arch_prctl
0.00 0.000000 0 1 set_tid_address
0.00 0.000000 0 2 openat
0.00 0.000000 0 1 set_robust_list
0.00 0.000000 0 1 prlimit64
0.00 0.000000 0 1 getrandom
0.00 0.000000 0 1 rseq
------ ----------- ----------- --------- --------- ----------------
100.00 0.000000 0 44 1 total
These are all of used syscalls to run the binary to this option:
case 3: {
const char *msg = "Hello from syscall write!\n";
printf("Writing message to stdout via write syscall...\n");
if (syscall(SYS_write, STDOUT_FILENO, msg, strlen(msg)) == -1) {
perror("write syscall failed");
}
Let’s build seccomp program to allow only these syscalls
#include <stdio.h>
#include <stdlib.h>
#include <unistd.h>
#include <stddef.h>
#include <sys/prctl.h>
#include <linux/seccomp.h>
#include <linux/filter.h>
#include <errno.h>
#include <sys/syscall.h>
#define SYS_READ 0
#define SYS_WRITE 1
#define SYS_CLOSE 3
#define SYS_FSTAT 5
#define SYS_MMAP 9
#define SYS_MPROTECT 10
#define SYS_MUNMAP 11
#define SYS_BRK 12
#define SYS_PREAD64 17
#define SYS_ACCESS 21
#define SYS_EXECVE 59
#define SYS_ARCH_PRCTL 158
#define SYS_SET_TID_ADDRESS 218
#define SYS_OPENAT 257
#define SYS_SET_ROBUST_LIST 273
#define SYS_PRLIMIT64 302
#define SYS_GETRANDOM 318
#define SYS_RSEQ 334
struct sock_filter filter[] = {
BPF_STMT(BPF_LD | BPF_W | BPF_ABS, offsetof(struct seccomp_data, nr)),
BPF_JUMP(BPF_JMP | BPF_JEQ | BPF_K, SYS_READ, 18, 0),
BPF_JUMP(BPF_JMP | BPF_JEQ | BPF_K, SYS_WRITE, 17, 0),
BPF_JUMP(BPF_JMP | BPF_JEQ | BPF_K, SYS_CLOSE, 16, 0),
BPF_JUMP(BPF_JMP | BPF_JEQ | BPF_K, SYS_FSTAT, 15, 0),
BPF_JUMP(BPF_JMP | BPF_JEQ | BPF_K, SYS_MMAP, 14, 0),
BPF_JUMP(BPF_JMP | BPF_JEQ | BPF_K, SYS_MPROTECT, 13, 0),
BPF_JUMP(BPF_JMP | BPF_JEQ | BPF_K, SYS_MUNMAP, 12, 0),
BPF_JUMP(BPF_JMP | BPF_JEQ | BPF_K, SYS_BRK, 11, 0),
BPF_JUMP(BPF_JMP | BPF_JEQ | BPF_K, SYS_PREAD64, 10, 0),
BPF_JUMP(BPF_JMP | BPF_JEQ | BPF_K, SYS_ACCESS, 9, 0),
BPF_JUMP(BPF_JMP | BPF_JEQ | BPF_K, SYS_EXECVE, 8, 0),
BPF_JUMP(BPF_JMP | BPF_JEQ | BPF_K, SYS_ARCH_PRCTL, 7, 0),
BPF_JUMP(BPF_JMP | BPF_JEQ | BPF_K, SYS_SET_TID_ADDRESS, 6, 0),
BPF_JUMP(BPF_JMP | BPF_JEQ | BPF_K, SYS_OPENAT, 5, 0),
BPF_JUMP(BPF_JMP | BPF_JEQ | BPF_K, SYS_SET_ROBUST_LIST, 4, 0),
BPF_JUMP(BPF_JMP | BPF_JEQ | BPF_K, SYS_PRLIMIT64, 3, 0),
BPF_JUMP(BPF_JMP | BPF_JEQ | BPF_K, SYS_GETRANDOM, 2, 0),
BPF_JUMP(BPF_JMP | BPF_JEQ | BPF_K, SYS_RSEQ, 1, 0),
BPF_STMT(BPF_RET | BPF_K, SECCOMP_RET_ERRNO | (EPERM & SECCOMP_RET_DATA)),
BPF_STMT(BPF_RET | BPF_K, SECCOMP_RET_ALLOW),
};
struct sock_fprog prog = {
.len = (unsigned short)(sizeof(filter) / sizeof(filter[0])),
.filter = filter,
};
int main(int argc, char *argv[]) {
if (argc < 2) {
fprintf(stderr, "Usage: %s <binary> [args...]\n", argv[0]);
exit(EXIT_FAILURE);
}
if (prctl(PR_SET_NO_NEW_PRIVS, 1, 0, 0, 0)) {
perror("prctl(PR_SET_NO_NEW_PRIVS) failed");
exit(EXIT_FAILURE);
}
if (prctl(PR_SET_SECCOMP, SECCOMP_MODE_FILTER, &prog)) {
perror("prctl(PR_SET_SECCOMP) failed");
exit(EXIT_FAILURE);
}
printf("Seccomp whitelist filter installed. Executing %s...\n", argv[1]);
execve(argv[1], &argv[1], NULL);
perror("execve failed");
return EXIT_FAILURE;
}
Compile it gcc -O2 -Wall seccomp.c -o seccomp, then chmod +x seccomp and finally ./seccomp ./syscalls and choose 3
Syscall Menu:
1. Execve /usr/bin/ls
2. Open /etc/passwd
3. Write a message to stdout
4. Exit
Enter your choice: 3
Writing message to stdout via write syscall...
Hello from syscall write!
Segmentation fault (core dumped)
If you choose something else like 2
Syscall Menu:
1. Execve /usr/bin/ls
2. Open /etc/passwd
3. Write a message to stdout
4. Exit
Enter your choice: 2
Opening /etc/passwd via open syscall...
open syscall failed: Operation not permitted
Segmentation fault (core dumped)
Notice that we have Segmentation fault (core dumped) . Simply because we have a blocked a syscall exit_group , run strace ./seccomp ./syscalls then choose 3:
[...]
fstat(0, {st_mode=S_IFCHR|0620, st_rdev=makedev(0x88, 0x2), ...}) = 0
write(1, "Enter your choice: ", 19Enter your choice: ) = 19
read(0, 3
"3\n", 1024) = 2
write(1, "Writing message to stdout via wr"..., 47Writing message to stdout via write syscall...
) = 47
write(1, "Hello from syscall write!\n", 26Hello from syscall write!
) = 26
exit_group(0) = -1 EPERM (Operation not permitted)
--- SIGSEGV {si_signo=SIGSEGV, si_code=SI_KERNEL, si_addr=NULL} ---
+++ killed by SIGSEGV (core dumped) +++
Segmentation fault (core dumped)
We need to whitelist exit_group too in our code. Strace couldn’t record exit_group syscall first because syscall such as exit_group syscall terminates the process immediately, so there’s no return value for strace to capture. Fixing our code is just by adding exit_group to the whitelist:
#include <stdio.h>
#include <stdlib.h>
#include <unistd.h>
#include <stddef.h>
#include <sys/prctl.h>
#include <linux/seccomp.h>
#include <linux/filter.h>
#include <errno.h>
#include <sys/syscall.h>
#define SYS_READ 0
#define SYS_WRITE 1
#define SYS_CLOSE 3
#define SYS_FSTAT 5
#define SYS_MMAP 9
#define SYS_MPROTECT 10
#define SYS_MUNMAP 11
#define SYS_BRK 12
#define SYS_PREAD64 17
#define SYS_ACCESS 21
#define SYS_EXECVE 59
#define SYS_ARCH_PRCTL 158
#define SYS_SET_TID_ADDRESS 218
#define SYS_OPENAT 257
#define SYS_SET_ROBUST_LIST 273
#define SYS_PRLIMIT64 302
#define SYS_GETRANDOM 318
#define SYS_RSEQ 334
#define SYS_EXIT_GROUP 231
struct sock_filter filter[] = {
BPF_STMT(BPF_LD | BPF_W | BPF_ABS, offsetof(struct seccomp_data, nr)),
BPF_JUMP(BPF_JMP | BPF_JEQ | BPF_K, SYS_EXIT_GROUP, 19, 0),
BPF_JUMP(BPF_JMP | BPF_JEQ | BPF_K, SYS_READ, 18, 0),
BPF_JUMP(BPF_JMP | BPF_JEQ | BPF_K, SYS_WRITE, 17, 0),
BPF_JUMP(BPF_JMP | BPF_JEQ | BPF_K, SYS_CLOSE, 16, 0),
BPF_JUMP(BPF_JMP | BPF_JEQ | BPF_K, SYS_FSTAT, 15, 0),
BPF_JUMP(BPF_JMP | BPF_JEQ | BPF_K, SYS_MMAP, 14, 0),
BPF_JUMP(BPF_JMP | BPF_JEQ | BPF_K, SYS_MPROTECT, 13, 0),
BPF_JUMP(BPF_JMP | BPF_JEQ | BPF_K, SYS_MUNMAP, 12, 0),
BPF_JUMP(BPF_JMP | BPF_JEQ | BPF_K, SYS_BRK, 11, 0),
BPF_JUMP(BPF_JMP | BPF_JEQ | BPF_K, SYS_PREAD64, 10, 0),
BPF_JUMP(BPF_JMP | BPF_JEQ | BPF_K, SYS_ACCESS, 9, 0),
BPF_JUMP(BPF_JMP | BPF_JEQ | BPF_K, SYS_EXECVE, 8, 0),
BPF_JUMP(BPF_JMP | BPF_JEQ | BPF_K, SYS_ARCH_PRCTL, 7, 0),
BPF_JUMP(BPF_JMP | BPF_JEQ | BPF_K, SYS_SET_TID_ADDRESS, 6, 0),
BPF_JUMP(BPF_JMP | BPF_JEQ | BPF_K, SYS_OPENAT, 5, 0),
BPF_JUMP(BPF_JMP | BPF_JEQ | BPF_K, SYS_SET_ROBUST_LIST, 4, 0),
BPF_JUMP(BPF_JMP | BPF_JEQ | BPF_K, SYS_PRLIMIT64, 3, 0),
BPF_JUMP(BPF_JMP | BPF_JEQ | BPF_K, SYS_GETRANDOM, 2, 0),
BPF_JUMP(BPF_JMP | BPF_JEQ | BPF_K, SYS_RSEQ, 1, 0),
BPF_STMT(BPF_RET | BPF_K, SECCOMP_RET_ERRNO | (EPERM & SECCOMP_RET_DATA)),
BPF_STMT(BPF_RET | BPF_K, SECCOMP_RET_ALLOW),
};
struct sock_fprog prog = {
.len = (unsigned short)(sizeof(filter) / sizeof(filter[0])),
.filter = filter,
};
int main(int argc, char *argv[]) {
if (argc < 2) {
fprintf(stderr, "Usage: %s <binary> [args...]\n", argv[0]);
exit(EXIT_FAILURE);
}
if (prctl(PR_SET_NO_NEW_PRIVS, 1, 0, 0, 0)) {
perror("prctl(PR_SET_NO_NEW_PRIVS) failed");
exit(EXIT_FAILURE);
}
if (prctl(PR_SET_SECCOMP, SECCOMP_MODE_FILTER, &prog)) {
perror("prctl(PR_SET_SECCOMP) failed");
exit(EXIT_FAILURE);
}
printf("Seccomp whitelist filter installed. Executing %s...\n", argv[1]);
execve(argv[1], &argv[1], NULL);
perror("execve failed");
return EXIT_FAILURE;
}
In the following part, we will explain the LSM kernel framework, a well-defined interface to enforce Mandatory Access Control (MAC) policies in a modular way.
LSM is a framework built into the Linux kernel that provides a set of hooks—well-defined points in the kernel code—where security modules can enforce access control and other security policies. These hooks are statically integrated into the kernel, meaning that a given security module (such as SELinux, AppArmor, or Smack) is selected at build or boot time via configuration options. Once active, the LSM framework directs security-relevant decisions (like permission checks, file access, or process operations) through these hooks so that the chosen security policy is applied consistently throughout the system.
Traditionally, LSM hooks require the security policy to be built into the kernel, and modifying policies often involves a kernel rebuild or reboot. With the rise of eBPF, it is now possible to attach eBPF programs to certain LSM hooks dynamically starting from kernel version 5.7. This modern approach allows for:
In short, while traditional LSM modules (such as SELinux) enforce security policies statically at build time, LSM with eBPF hooks introduces dynamic, runtime adaptability to kernel security. This hybrid approach leverages the robustness of the LSM framework and the operational agility of eBPF. The LSM interface triggers immediately before the kernel acts on a data structure, and at each hook point, a callback function determines whether to permit the action.
Let’s explore together LSM with eBPF. First, we need to check if BPF LSM is supported by the kernel:
cat /boot/config-$(uname -r) | grep BPF_LSM
If the output is CONFIG_BPF_LSM=y then the BPF LSM is supported. Then we check if BPF LSM is enabled:
cat /sys/kernel/security/lsm
if the output contains bpf then the module is enabled like the following:
lockdown,capability,landlock,yama,apparmor,tomoyo,bpf,ipe,ima,evm
If the output includes ndlock, lockdown, yama, integrity, and apparmor along with bpf, add GRUB_CMDLINE_LINUX="lsm=ndlock,lockdown,yama,integrity,apparmor,bpf" to the /etc/default/grub file, update GRUB using sudo update-grub2, and reboot.
The list of all LSM hooks are defined in include/linux/lsm_hook_defs.h, the following is just an example of it:
LSM_HOOK(int, 0, path_chmod, const struct path *path, umode_t mode)
LSM_HOOK(int, 0, path_chown, const struct path *path, kuid_t uid, kgid_t gid)
LSM_HOOK(int, 0, path_chroot, const struct path *path)
LSM hooks documentation which has descriptive documentation for most of LSM hooks such as:
* @path_chmod:
* Check for permission to change a mode of the file @path. The new
* mode is specified in @mode.
* @path contains the path structure of the file to change the mode.
* @mode contains the new DAC's permission, which is a bitmask of
* constants from <include/uapi/linux/stat.h>.
* Return 0 if permission is granted.
* @path_chown:
* Check for permission to change owner/group of a file or directory.
* @path contains the path structure.
* @uid contains new owner's ID.
* @gid contains new group's ID.
* Return 0 if permission is granted.
* @path_chroot:
* Check for permission to change root directory.
* @path contains the path structure.
* Return 0 if permission is granted.
Let’s explore LSM with path_mkdir LSM hook which described as the following:
* @path_mkdir:
* Check permissions to create a new directory in the existing directory
* associated with path structure @path.
* @dir contains the path structure of parent of the directory
* to be created.
* @dentry contains the dentry structure of new directory.
* @mode contains the mode of new directory.
* Return 0 if permission is granted.
path_mkdir is defined in LSM as the following:
LSM_HOOK(int, 0, path_mkdir, const struct path *dir, struct dentry *dentry, umode_t mode)
#include "vmlinux.h"
#include <bpf/bpf_core_read.h>
#include <bpf/bpf_helpers.h>
#include <bpf/bpf_tracing.h>
#define FULL_PATH_LEN 256
char _license[] SEC("license") = "GPL";
SEC("lsm/path_mkdir")
int BPF_PROG(path_mkdir, const struct path *dir, struct dentry *dentry, umode_t mode, int ret)
{
char full_path[FULL_PATH_LEN] = {};
u64 uid_gid = bpf_get_current_uid_gid();
u32 uid = (u32) uid_gid;
const char *dname = (const char *)BPF_CORE_READ(dentry, d_name.name);
bpf_path_d_path((struct path *)dir, full_path, sizeof(full_path));
bpf_printk("LSM: mkdir '%s' in directory '%s' with mode %d, UID %d\n", dname, full_path, mode, uid);
return 0;
}
struct path is data structure used by the VFS (Virtual Filesystem) layer to represent a location in the filesystem. struct path is defined in include/linux/path.h as the following
struct path {
struct vfsmount *mnt;
struct dentry *dentry;
}
struct dentry directory entry data structure which is responsible for making links between inodes and filename. struct dentry is defined in include/linux/dcache.h as the following:
struct dentry {
unsigned int d_flags;
seqcount_spinlock_t d_seq;
struct hlist_bl_node d_hash;
struct dentry *d_parent;
struct qstr d_name;
struct inode *d_inode;
unsigned char d_iname[DNAME_INLINE_LEN];
const struct dentry_operations *d_op;
struct super_block *d_sb;
unsigned long d_time;
void *d_fsdata;
struct lockref d_lockref;
union {
struct list_head d_lru;
wait_queue_head_t *d_wait;
};
struct hlist_node d_sib;
struct hlist_head d_children;
union {
struct hlist_node d_alias;
struct hlist_bl_node d_in_lookup_hash;
struct rcu_head d_rcu;
} d_u;
};
struct dentry data structure has a member struct qstr data structure that contains information about the name (a pointer to the actual character array containing the name) defined in include/linux/dcache.h as the following:
struct qstr {
union {
struct {
HASH_LEN_DECLARE;
};
u64 hash_len;
};
const unsigned char *name;
};
That’s how you extract the filename: by reading the dentry data structure, then accessing its d_name member, and finally retrieving the name member using BPF_CORE_READ macro.
const char *dname = (const char *)BPF_CORE_READ(dentry, d_name.name);
bpf_path_d_path Kernel function i used to extract the path name for the supplied path data structure defined in fs/bpf_fs_kfuncs.c in the kernel source code as the following:
__bpf_kfunc int bpf_path_d_path(struct path *path, char *buf, size_t buf__sz)
{
int len;
char *ret;
if (!buf__sz)
return -EINVAL;
ret = d_path(path, buf, buf__sz);
if (IS_ERR(ret))
return PTR_ERR(ret);
len = buf + buf__sz - ret;
memmove(buf, ret, len);
return len;
}
There is a comment in the source code very descriptive about this kernel function which says:
* bpf_path_d_path - resolve the pathname for the supplied path
* @path: path to resolve the pathname for
* @buf: buffer to return the resolved pathname in
* @buf__sz: length of the supplied buffer
*
* Resolve the pathname for the supplied *path* and store it in *buf*. This BPF
* kfunc is the safer variant of the legacy bpf_d_path() helper and should be
* used in place of bpf_d_path() whenever possible. It enforces KF_TRUSTED_ARGS
* semantics, meaning that the supplied *path* must itself hold a valid
* reference, or else the BPF program will be outright rejected by the BPF
* verifier.
*
* This BPF kfunc may only be called from BPF LSM programs.
*
* Return: A positive integer corresponding to the length of the resolved
* pathname in *buf*, including the NUL termination character. On error, a
* negative integer is returned.
bpf_get_current_uid_gid helper function to get the current UID and GID.
u64 uid_gid = bpf_get_current_uid_gid();
u32 uid = (u32) uid_gid; // the lower 32 bits are the UID
The user-space code is like the following:
#include <stdio.h>
#include <unistd.h>
#include <sys/resource.h>
#include <bpf/libbpf.h>
#include "lsm_mkdir.skel.h"
static int libbpf_print_fn(enum libbpf_print_level level, const char *format, va_list args)
{
return vfprintf(stderr, format, args);
}
int main(int argc, char **argv)
{
struct lsm_mkdir *skel;
int err;
libbpf_set_print(libbpf_print_fn);
skel = lsm_mkdir__open();
if (!skel) {
fprintf(stderr, "Failed to open BPF skeleton\n");
return 1;
}
err = lsm_mkdir__load(skel);
if (err) {
fprintf(stderr, "Failed to load and verify BPF skeleton\n");
goto cleanup;
}
err = lsm_mkdir__attach(skel);
if (err) {
fprintf(stderr, "Failed to attach BPF skeleton\n");
goto cleanup;
}
printf("Successfully started! Please run `sudo cat /sys/kernel/debug/tracing/trace_pipe` "
"to see output of the BPF programs.\n");
for (;;) {
fprintf(stderr, ".");
sleep(1);
}
cleanup:
lsm_mkdir__destroy(skel);
return -err;
}
Output:
[...] LSM: mkdir 'test1' in directory '/tmp' with mode 511, UID 1000
[...] LSM: mkdir 'test2' in directory '/tmp' with mode 511, UID 1000
eBPF LSM are classified as BPF_PROG_TYPE_LSM, sudo strace -ebpf ./loader will show similar output:
[...]
bpf(BPF_PROG_LOAD, {prog_type=BPF_PROG_TYPE_LSM, insn_cnt=68, insns=0x560837bfc0e0, license="GPL", log_level=0, log_size=0, log_buf=NULL, kern_version=KERNEL_VERSION(6, 12, 12), prog_flags=0, prog_name="path_mkdir", prog_ifindex=0, expected_attach_type=BPF_LSM_MAC, prog_btf_fd=4, func_info_rec_size=8, func_info=0x560837bfa650, func_info_cnt=1, line_info_rec_size=16, line_info=0x560837bfcfb0, line_info_cnt=11, attach_btf_id=58073, attach_prog_fd=0, fd_array=NULL}, 148) = 5
This is not all, LSM is not just about observability, LSM are made to take decisions, define controls and enforce them. Let’s explore another example which its main objective to block opining /etc/passwd file.
#include "vmlinux.h"
#include <errno.h>
#include <bpf/bpf_core_read.h>
#include <bpf/bpf_helpers.h>
#include <bpf/bpf_tracing.h>
#define FULL_PATH_LEN 256
char _license[] SEC("license") = "GPL";
SEC("lsm/file_open")
int BPF_PROG(file_open, struct file *file)
{
char full_path[FULL_PATH_LEN] = {};
int ret;
const char target[] = "/etc/passwd";
int i;
ret = bpf_path_d_path(&file->f_path, full_path, sizeof(full_path));
if (ret < 0)
return 0;
for (i = 0; i < sizeof(target) - 1; i++) {
if (full_path[i] != target[i])
break;
}
if (i == sizeof(target) - 1) {
bpf_printk("Blocking open of: %s\n", full_path);
return -EPERM;
}
return 0;
}
struct file data structure represents an instance of an open file or device within a process defined in include/linux/fs.h header file in the kernel source code as the following:
struct file {
atomic_long_t f_count;
spinlock_t f_lock;
fmode_t f_mode;
const struct file_operations *f_op;
struct address_space *f_mapping;
void *private_data;
struct inode *f_inode;
unsigned int f_flags;
unsigned int f_iocb_flags;
const struct cred *f_cred;
struct path f_path;
union {
struct mutex f_pos_lock;
u64 f_pipe;
};
loff_t f_pos;
#ifdef CONFIG_SECURITY
void *f_security;
#endif
struct fown_struct *f_owner;
errseq_t f_wb_err;
errseq_t f_sb_err;
#ifdef CONFIG_EPOLL
struct hlist_head *f_ep;
#endif
union {
struct callback_head f_task_work;
struct llist_node f_llist;
struct file_ra_state f_ra;
freeptr_t f_freeptr;
};
struct file members are described as the following:
* struct file - Represents a file
* @f_count: reference count
* @f_lock: Protects f_ep, f_flags. Must not be taken from IRQ context.
* @f_mode: FMODE_* flags often used in hotpaths
* @f_op: file operations
* @f_mapping: Contents of a cacheable, mappable object.
* @private_data: filesystem or driver specific data
* @f_inode: cached inode
* @f_flags: file flags
* @f_iocb_flags: iocb flags
* @f_cred: stashed credentials of creator/opener
* @f_path: path of the file
* @f_pos_lock: lock protecting file position
* @f_pipe: specific to pipes
* @f_pos: file position
* @f_security: LSM security context of this file
* @f_owner: file owner
* @f_wb_err: writeback error
* @f_sb_err: per sb writeback errors
* @f_ep: link of all epoll hooks for this file
* @f_task_work: task work entry point
* @f_llist: work queue entrypoint
* @f_ra: file's readahead state
* @f_freeptr: Pointer used by SLAB_TYPESAFE_BY_RCU file cache (don't touch.)
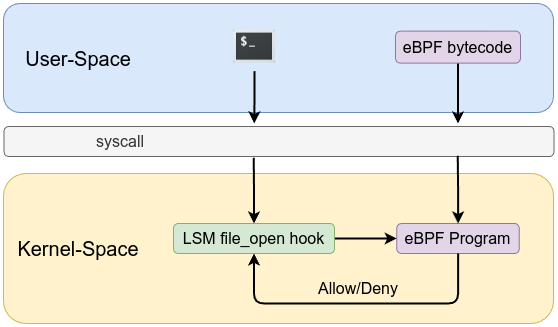
Output when opening /etc/passwd shows the following:
cat-1673 [003] ...11 262.949842: bpf_trace_printk: Blocking open of: /etc/passwd
The code can also work based on comparing the inode rather than the filename. The following example uses a hard-coded inode value for demonstration purposes only.
#include "vmlinux.h"
#include <errno.h>
#include <bpf/bpf_core_read.h>
#include <bpf/bpf_helpers.h>
#include <bpf/bpf_tracing.h>
#define TARGET_INODE 788319
char _license[] SEC("license") = "GPL";
SEC("lsm/file_open")
int BPF_PROG(file_open, struct file *file)
{
u64 ino = BPF_CORE_READ(file, f_inode, i_ino);
if (ino == TARGET_INODE) {
bpf_printk("Blocking open: inode %llu matched TARGET_INO\n", ino);
return -EPERM;
}
return 0;
}
First we need to obtain /etc/passwd inode using ls-i /etc/passwd:
788319 /etc/passwd
Then you use that number in your code to check against the file’s inode. Let’s see another example for socket. socket_create described in the source code as the following:
* @socket_create:
* Check permissions prior to creating a new socket.
* @family contains the requested protocol family.
* @type contains the requested communications type.
* @protocol contains the requested protocol.
* @kern set to 1 if a kernel socket.
* Return 0 if permission is granted.
socket_create LSM hook look like this in the source code also:
LSM_HOOK(int, 0, socket_create, int family, int type, int protocol, int kern)
Let’s see how to prevent UID 1000 from creating a new socket:
#include "vmlinux.h"
#include <errno.h>
#include <bpf/bpf_helpers.h>
#include <bpf/bpf_tracing.h>
char _license[] SEC("license") = "GPL";
SEC("lsm/socket_create")
int BPF_PROG(socket_create, int family, int type, int protocol, int kern)
{
u64 uid_gid = bpf_get_current_uid_gid();
u32 uid = (u32) uid_gid;
if (uid == 1000) {
bpf_printk("Blocking socket_create for uid %d, family %d, type %d, protocol %d\n",
uid, family, type, protocol);
return -EPERM;
}
return 0;
}
When a process running as UID 1000 (for example, when a user attempts to run ping or ssh) tries to create a new socket, the LSM hook for socket creation is triggered. The eBPF program intercepts the system call and uses bpf_get_current_uid_gid() to obtain the current UID. If the UID is 1000, the program returns -EPERM (which means “Operation not permitted”). This return value causes the socket creation to fail.
ping-2197 [...] Blocking socket_create for uid 1000, family 2, type 2, protocol 1
ssh-2198 [...] Blocking socket_create for uid 1000, family 2, type 1, protocol 6
Of course—you can fine-tune your policy based on the arguments passed to the hook. For example, if you only want to block socket creation for TCP (protocol number 6), you can do something like this:
if (protocol == 6) {
return -EPERM;
}
This means that only when the protocol equals 6 (TCP) will the socket creation be blocked, while other protocols will be allowed. Socket family is defined in include/linux/socket.h, while socket type is defined in include/linux/net.h and socket protocol is defined in include/uapi/linux/in.h.
I strongly recommend exploring more LSM hooks on your own and consulting the documentation—you’ll quickly see that working with them is not hard at all. Next, we will see Landlock which allows a process to restrict its own privileges in unprivileged manner or process sandbox.
Landlock is a Linux Security Module (LSM) introduced in Linux kernel 5.13 based on eBPF that allows processes to restrict their own privileges in a fine-grained, stackable, and unprivileged manner. Unlike traditional Mandatory Access Control (MAC) systems such as SELinux and AppArmor, which require administrative setup, Landlock enables unprivileged processes to sandbox themselves. This makes it particularly useful for running potentially vulnerable applications while limiting their ability to perform unauthorized actions.
By defining specific access rules, processes can restrict themselves to only the necessary files and network operations, preventing unauthorized access or modification of sensitive data. This capability is particularly valuable in scenarios where applications handle untrusted input or where minimizing the impact of potential security breaches is critical.
A key advantage of Landlock is its layered security model. Rulesets in Landlock are stackable, meaning multiple rulesets can be enforced incrementally to tighten security restrictions over time. Once a Landlock ruleset is enforced, it cannot be relaxed or removed, ensuring that restrictions remain in place throughout the process’s lifetime. Additionally, Landlock operates at the kernel object (e.g., file, process, socket) level rather than filtering syscalls, providing minimal overhead, a stable interface for future developments and race condition free.
To check if Landlock is up and running is by executing sudo dmesg | grep landlock || journalctl -kb -g landlock
[ 0.043191] LSM: initializing lsm=lockdown,capability,landlock,yama,apparmor,tomoyo,bpf,ipe,ima,evm
[ 0.043191] landlock: Up and running.
include/uapi/linux/landlock.h header file : handled_access_fs, handled_access_net and scoped as defined in the following data structure:struct landlock_ruleset_attr {
/**
* @handled_access_fs: Bitmask of handled filesystem actions
* (cf. `Filesystem flags`_).
*/
__u64 handled_access_fs;
/**
* @handled_access_net: Bitmask of handled network actions (cf. `Network
* flags`_).
*/
__u64 handled_access_net;
/**
* @scoped: Bitmask of scopes (cf. `Scope flags`_)
* restricting a Landlock domain from accessing outside
* resources (e.g. IPCs).
*/
__u64 scoped;
};
handled_access_fs rules to sandbox a process to a set of actions on files and directories and they are as the following:
#define LANDLOCK_ACCESS_FS_EXECUTE (1ULL << 0)
#define LANDLOCK_ACCESS_FS_WRITE_FILE (1ULL << 1)
#define LANDLOCK_ACCESS_FS_READ_FILE (1ULL << 2)
#define LANDLOCK_ACCESS_FS_READ_DIR (1ULL << 3)
#define LANDLOCK_ACCESS_FS_REMOVE_DIR (1ULL << 4)
#define LANDLOCK_ACCESS_FS_REMOVE_FILE (1ULL << 5)
#define LANDLOCK_ACCESS_FS_MAKE_CHAR (1ULL << 6)
#define LANDLOCK_ACCESS_FS_MAKE_DIR (1ULL << 7)
#define LANDLOCK_ACCESS_FS_MAKE_REG (1ULL << 8)
#define LANDLOCK_ACCESS_FS_MAKE_SOCK (1ULL << 9)
#define LANDLOCK_ACCESS_FS_MAKE_FIFO (1ULL << 10)
#define LANDLOCK_ACCESS_FS_MAKE_BLOCK (1ULL << 11)
#define LANDLOCK_ACCESS_FS_MAKE_SYM (1ULL << 12)
#define LANDLOCK_ACCESS_FS_REFER (1ULL << 13)
#define LANDLOCK_ACCESS_FS_TRUNCATE (1ULL << 14)
#define LANDLOCK_ACCESS_FS_IOCTL_DEV (1ULL << 15)
They are explained in include/uapi/linux/landlock.h as the following:
* - %LANDLOCK_ACCESS_FS_EXECUTE: Execute a file.
* - %LANDLOCK_ACCESS_FS_WRITE_FILE: Open a file with write access.
* - %LANDLOCK_ACCESS_FS_READ_FILE: Open a file with read access.
* - %LANDLOCK_ACCESS_FS_READ_DIR: Open a directory or list its content.
* - %LANDLOCK_ACCESS_FS_REMOVE_DIR: Remove an empty directory or rename one.
* - %LANDLOCK_ACCESS_FS_REMOVE_FILE: Unlink (or rename) a file.
* - %LANDLOCK_ACCESS_FS_MAKE_CHAR: Create (or rename or link) a character device.
* - %LANDLOCK_ACCESS_FS_MAKE_DIR: Create (or rename) a directory.
* - %LANDLOCK_ACCESS_FS_MAKE_REG: Create (or rename or link) a regular file.
* - %LANDLOCK_ACCESS_FS_MAKE_SOCK: Create (or rename or link) a UNIX domain socket.
* - %LANDLOCK_ACCESS_FS_MAKE_FIFO: Create (or rename or link) a named pipe.
* - %LANDLOCK_ACCESS_FS_MAKE_BLOCK: Create (or rename or link) a block device.
* - %LANDLOCK_ACCESS_FS_MAKE_SYM: Create (or rename or link) a symbolic link.
* - %LANDLOCK_ACCESS_FS_REFER: Link or rename a file from or to a different directory (i.e. reparent a file hierarchy).
* - %LANDLOCK_ACCESS_FS_TRUNCATE: Truncate a file with:truncate(2), ftruncate(2), creat(2), or open(2) with O_TRUNC.
* - %LANDLOCK_ACCESS_FS_IOCTL_DEV: Invoke :manpage:`ioctl(2)` commands on an opened character or block device.
handled_access_net rules to sandbox a process to a set of network actions and they are defined as the following:
#define LANDLOCK_ACCESS_NET_BIND_TCP (1ULL << 0)
#define LANDLOCK_ACCESS_NET_CONNECT_TCP (1ULL << 1)
handled_access_net rules are explained as the following:
* - %LANDLOCK_ACCESS_NET_BIND_TCP: Bind a TCP socket to a local port.
* - %LANDLOCK_ACCESS_NET_CONNECT_TCP: Connect an active TCP socket to
scoped rules to sandbox a process from a set of IPC (inter-process communication) actions or sending signals and they are defined as the following:
#define LANDLOCK_SCOPE_ABSTRACT_UNIX_SOCKET (1ULL << 0)
#define LANDLOCK_SCOPE_SIGNAL (1ULL << 1)
scoped rules are explained as the following:
* - %LANDLOCK_SCOPE_ABSTRACT_UNIX_SOCKET: Restrict a sandboxed process from connecting to an abstract UNIX socket created by a process outside the related Landlock domain (e.g. a parent domain or a non-sandboxed process).
* - %LANDLOCK_SCOPE_SIGNAL: Restrict a sandboxed process from sending a signal to another process outside the domain
Ruleset Creation is done using landlock_create_ruleset() syscall.
landlock_path_beneath_attr and landlock_net_port_attr. For example, block access to entire file system except read files, read directories and execute on /usr/bin/.
landlock_path_beneath_attr data structure is defined in include/uapi/linux/landlock.h header file as the following:struct landlock_path_beneath_attr {
/**
* @allowed_access: Bitmask of allowed actions for this file hierarchy
* (cf. `Filesystem flags`_).
*/
__u64 allowed_access;
/**
* @parent_fd: File descriptor, preferably opened with ``O_PATH``,
* which identifies the parent directory of a file hierarchy, or just a
* file.
*/
__s32 parent_fd;
/*
* This struct is packed to avoid trailing reserved members.
* Cf. security/landlock/syscalls.c:build_check_abi()
*/
} __attribute__((packed));
landlock_net_port_attr data structure is defined in include/uapi/linux/landlock.h header file as the following:
struct landlock_net_port_attr {
/**
* @allowed_access: Bitmask of allowed network actions for a port
* (cf. `Network flags`_).
*/
__u64 allowed_access;
/**
* @port: Network port in host endianness.
*
* It should be noted that port 0 passed to :manpage:`bind(2)` will bind
* to an available port from the ephemeral port range. This can be
* configured with the ``/proc/sys/net/ipv4/ip_local_port_range`` sysctl
* (also used for IPv6).
*
* A Landlock rule with port 0 and the ``LANDLOCK_ACCESS_NET_BIND_TCP``
* right means that requesting to bind on port 0 is allowed and it will
* automatically translate to binding on the related port range.
*/
__u64 port;
};
Adding rules can be done using landlock_add_rule() syscall.
no_new_privs set, or with CAP_SYS_ADMIN in its namespace) can call landlock_restrict_self() syscall to enforce it on itself and all child processes. After enforcement, the process can still add more restrictions later, but cannot remove existing ones.landlock_restrict_self() syscall will add a new layer, and you can stack up to 16 layers (rulesets). If layers exceed 16, it will return E2BIG (Argument list too long).
When you call landlock_create_ruleset() with attr = NULL and size = 0, it returns the highest supported ABI. A recommended practice is to do a best-effort approach: detect the system’s ABI, then disable features that are not supported, so your program runs consistently on different kernels.
ABI < 2: Did not allow renaming/linking across directories.ABI < 3: File truncation could not be restricted.ABI < 4: No network restriction support.ABI < 5: Could not restrict ioctl(2) on devices.ABI < 6: No scope restrictions for signals or abstract Unix sockets.It’s recommended to detect Landlock ABI version to maintain compatibility across different kernel versions as stated in the kernel manual:
int abi;
abi = landlock_create_ruleset(NULL, 0, LANDLOCK_CREATE_RULESET_VERSION);
if (abi < 0) {
/* Degrades gracefully if Landlock is not handled. */
perror("The running kernel does not enable to use Landlock");
return 0;
}
switch (abi) {
case 1:
/* Removes LANDLOCK_ACCESS_FS_REFER for ABI < 2 */
ruleset_attr.handled_access_fs &= ~LANDLOCK_ACCESS_FS_REFER;
__attribute__((fallthrough));
case 2:
/* Removes LANDLOCK_ACCESS_FS_TRUNCATE for ABI < 3 */
ruleset_attr.handled_access_fs &= ~LANDLOCK_ACCESS_FS_TRUNCATE;
__attribute__((fallthrough));
case 3:
/* Removes network support for ABI < 4 */
ruleset_attr.handled_access_net &=
~(LANDLOCK_ACCESS_NET_BIND_TCP |
LANDLOCK_ACCESS_NET_CONNECT_TCP);
__attribute__((fallthrough));
case 4:
/* Removes LANDLOCK_ACCESS_FS_IOCTL_DEV for ABI < 5 */
ruleset_attr.handled_access_fs &= ~LANDLOCK_ACCESS_FS_IOCTL_DEV;
__attribute__((fallthrough));
case 5:
/* Removes LANDLOCK_SCOPE_* for ABI < 6 */
ruleset_attr.scoped &= ~(LANDLOCK_SCOPE_ABSTRACT_UNIX_SOCKET |
LANDLOCK_SCOPE_SIGNAL);
}
Let’s see a simple example to sandbox a process from communicating through TCP.
#define _GNU_SOURCE
#include <linux/landlock.h>
#include <sys/prctl.h>
#include <unistd.h>
#include <stdio.h>
#include <stdlib.h>
#include <errno.h>
#include <string.h>
#include <sys/syscall.h>
static inline int landlock_create_ruleset(const struct landlock_ruleset_attr *attr, size_t size, __u32 flags) {
return syscall(__NR_landlock_create_ruleset, attr, size, flags);
}
static inline int landlock_restrict_self(int ruleset_fd) {
return syscall(__NR_landlock_restrict_self, ruleset_fd, 0);
}
int main(int argc, char **argv) {
if (argc < 2) {
fprintf(stderr, "Usage: %s <binary> [args...]\n", argv[0]);
return 1;
}
int abi = landlock_create_ruleset(NULL, 0, LANDLOCK_CREATE_RULESET_VERSION);
if (abi < 4) {
fprintf(stderr, "Landlock network restrictions are not supported (need ABI >= 4).\n");
fprintf(stderr, "Running %s without Landlock.\n", argv[1]);
execvp(argv[1], &argv[1]);
perror("execvp");
return 1;
}
struct landlock_ruleset_attr ruleset_attr = {
.handled_access_net = LANDLOCK_ACCESS_NET_CONNECT_TCP | LANDLOCK_ACCESS_NET_BIND_TCP
};
int ruleset_fd = landlock_create_ruleset(&ruleset_attr, sizeof(ruleset_attr), 0);
if (ruleset_fd < 0) {
perror("landlock_create_ruleset");
return 1;
}
if (prctl(PR_SET_NO_NEW_PRIVS, 1, 0, 0, 0)) {
perror("prctl(PR_SET_NO_NEW_PRIVS)");
close(ruleset_fd);
return 1;
}
if (landlock_restrict_self(ruleset_fd)) {
perror("landlock_restrict_self");
close(ruleset_fd);
return 1;
}
close(ruleset_fd);
execvp(argv[1], &argv[1]);
perror("execvp failed");
return 1;
}
First, we define inline helper functions to provide a simplified interface for the landlock_create_ruleset and landlock_restrict_self system calls.
static inline int landlock_create_ruleset(const struct landlock_ruleset_attr *attr, size_t size, __u32 flags) {
return syscall(__NR_landlock_create_ruleset, attr, size, flags);
}
static inline int landlock_restrict_self(int ruleset_fd) {
return syscall(__NR_landlock_restrict_self, ruleset_fd, 0);
}
Then, check Landlock ABI support (version >=4 supports network restrictions):
int abi = landlock_create_ruleset(NULL, 0, LANDLOCK_CREATE_RULESET_VERSION);
if (abi < 4) {
fprintf(stderr, "Landlock network restrictions are not supported (need ABI >= 4).\n");
fprintf(stderr, "Running %s without Landlock.\n", argv[1]);
execvp(argv[1], &argv[1]);
perror("execvp");
return 1;
}
Then, define rules using landlock_ruleset_attr data structure:
struct landlock_ruleset_attr ruleset_attr = {
.handled_access_net = LANDLOCK_ACCESS_NET_CONNECT_TCP | LANDLOCK_ACCESS_NET_BIND_TCP
};
Next, Ruleset creation using landlock_create_ruleset() syscall and get ruleset_fd as return value:
int ruleset_fd = landlock_create_ruleset(&ruleset_attr, sizeof(ruleset_attr), 0);
if (ruleset_fd < 0) {
perror("landlock_create_ruleset");
return 1;
}
Then, prevent the process from gaining new privileges using prctl:
if (prctl(PR_SET_NO_NEW_PRIVS, 1, 0, 0, 0)) {
perror("prctl(PR_SET_NO_NEW_PRIVS)");
close(ruleset_fd);
return 1;
}
Finally, enforce rules using landlock_restrict_self() syscall:
if (landlock_restrict_self(ruleset_fd)) {
perror("landlock_restrict_self");
close(ruleset_fd);
return 1;
}
Compile the code gcc -Wall landlock_no_tcp.c -o landlock_no_tcp, then, let’s test it ./landlock_no_tcp ssh 192.168.1.2
ssh: connect to host 192.168.1.2 port 22: Permission denied
We can see why this happened using strace ./landlock_no_tcp ssh 192.168.1.2:
[...]
socket(AF_INET, SOCK_STREAM, IPPROTO_TCP) = 3
fcntl(3, F_SETFD, FD_CLOEXEC) = 0
getsockname(3, {sa_family=AF_INET, sin_port=htons(0), sin_addr=inet_addr("0.0.0.0")}, [128 => 16]) = 0
setsockopt(3, SOL_IP, IP_TOS, [16], 4) = 0
connect(3, {sa_family=AF_INET, sin_port=htons(22), sin_addr=inet_addr("192.168.1.2")}, 16) = -1 EACCES (Permission denied)
close(3) = 0
getpid() = 2245
write(2, "ssh: connect to host 192.168.1.2"..., 61ssh: connect to host 192.168.1.2 port 22: Permission denied
) = 61
munmap(0x7f9c722d3000, 135168) = 0
exit_group(255) = ?
+++ exited with 255 +++
We can see what is going to happen if we use sudo strace ./landlock_no_tcp sudo ssh 192.168.1.2
[...]
read(3, "", 4096) = 0
close(3) = 0
geteuid() = 1000
prctl(PR_GET_NO_NEW_PRIVS, 0, 0, 0, 0) = 1
openat(AT_FDCWD, "/usr/share/locale/locale.alias", O_RDONLY|O_CLOEXEC) = 3
fstat(3, {st_mode=S_IFREG|0644, st_size=2996, ...}) = 0
read(3, "# Locale name alias data base.\n#"..., 4096) = 2996
read(3, "", 4096) = 0
close(3) = 0
write(2, "sudo", 4sudo) = 4
write(2, ": ", 2: ) = 2
write(2, "The \"no new privileges\" flag is "..., 78The "no new privileges" flag is set, which prevents sudo from running as root.) = 78
[...]
The output should look like the following:
sudo: The "no new privileges" flag is set, which prevents sudo from running as root.
sudo: If sudo is running in a container, you may need to adjust the container configuration to disable the flag.
Below another simplified example illustrating how to use Landlock to allow read-only access to /usr and /etc/ssl/certs while permitting only TCP port 443 connections, and denying all other filesystem and TCP actions:
#define _GNU_SOURCE
#include <linux/landlock.h>
#include <sys/prctl.h>
#include <sys/syscall.h>
#include <fcntl.h>
#include <stdio.h>
#include <stdlib.h>
#include <unistd.h>
#include <errno.h>
static inline int landlock_create_ruleset(const struct landlock_ruleset_attr *attr, size_t size, __u32 flags) {
return syscall(__NR_landlock_create_ruleset, attr, size, flags);
}
static inline int landlock_add_rule(int ruleset_fd, enum landlock_rule_type rule_type, const void *rule_attr, __u32 flags) {
return syscall(__NR_landlock_add_rule, ruleset_fd, rule_type, rule_attr, flags);
}
static inline int landlock_restrict_self(int ruleset_fd, __u32 flags) {
return syscall(__NR_landlock_restrict_self, ruleset_fd, flags);
}
int main(int argc, char *argv[]) {
if (argc < 2) {
fprintf(stderr, "Usage: %s <binary-to-sandbox> [args...]\n", argv[0]);
return 1;
}
int abi = landlock_create_ruleset(NULL, 0, LANDLOCK_CREATE_RULESET_VERSION);
if (abi < 0) {
fprintf(stderr, "Landlock not available. Running %s without restrictions.\n", argv[1]);
execvp(argv[1], &argv[1]);
perror("execvp");
return 1;
}
struct landlock_ruleset_attr ruleset_attr = {
.handled_access_fs =
LANDLOCK_ACCESS_FS_EXECUTE |
LANDLOCK_ACCESS_FS_READ_FILE |
LANDLOCK_ACCESS_FS_READ_DIR,
.handled_access_net = LANDLOCK_ACCESS_NET_BIND_TCP | LANDLOCK_ACCESS_NET_CONNECT_TCP,
};
int ruleset_fd = landlock_create_ruleset(&ruleset_attr, sizeof(ruleset_attr), 0);
if (ruleset_fd < 0) {
perror("landlock_create_ruleset");
return 1;
}
struct landlock_path_beneath_attr usr_attr = {
.allowed_access = LANDLOCK_ACCESS_FS_READ_FILE | LANDLOCK_ACCESS_FS_READ_DIR | LANDLOCK_ACCESS_FS_EXECUTE
};
usr_attr.parent_fd = open("/usr", O_PATH | O_CLOEXEC);
if (usr_attr.parent_fd < 0) {
perror("open /usr");
close(ruleset_fd);
return 1;
}
if (landlock_add_rule(ruleset_fd, LANDLOCK_RULE_PATH_BENEATH, &usr_attr, 0) < 0) {
perror("landlock_add_rule (/usr)");
close(usr_attr.parent_fd);
close(ruleset_fd);
return 1;
}
close(usr_attr.parent_fd);
struct landlock_path_beneath_attr ssl_attr = {
.allowed_access = LANDLOCK_ACCESS_FS_READ_FILE | LANDLOCK_ACCESS_FS_READ_DIR
};
ssl_attr.parent_fd = open("/etc/ssl/certs", O_PATH | O_CLOEXEC);
if (ssl_attr.parent_fd < 0) {
perror("open /etc/ssl/certs");
close(ruleset_fd);
return 1;
}
if (landlock_add_rule(ruleset_fd, LANDLOCK_RULE_PATH_BENEATH, &ssl_attr, 0) < 0) {
perror("landlock_add_rule (/etc/ssl/certs)");
close(ssl_attr.parent_fd);
close(ruleset_fd);
return 1;
}
close(ssl_attr.parent_fd);
if (abi >= 4) {
struct landlock_net_port_attr net_attr = {
.allowed_access = LANDLOCK_ACCESS_NET_CONNECT_TCP,
.port = 443
};
if (landlock_add_rule(ruleset_fd, LANDLOCK_RULE_NET_PORT, &net_attr, 0) < 0) {
perror("landlock_add_rule (HTTPS only)");
close(ruleset_fd);
return 1;
}
}
if (prctl(PR_SET_NO_NEW_PRIVS, 1, 0, 0, 0)) {
perror("prctl(PR_SET_NO_NEW_PRIVS)");
close(ruleset_fd);
return 1;
}
if (landlock_restrict_self(ruleset_fd, 0)) {
perror("landlock_restrict_self");
close(ruleset_fd);
return 1;
}
close(ruleset_fd);
execvp(argv[1], &argv[1]);
perror("execvp failed");
return 1;
}
Here we defined rules for file access and network access then ruleset creation :
struct landlock_ruleset_attr ruleset_attr = {
.handled_access_fs =
LANDLOCK_ACCESS_FS_EXECUTE |
LANDLOCK_ACCESS_FS_READ_FILE |
LANDLOCK_ACCESS_FS_READ_DIR,
.handled_access_net = LANDLOCK_ACCESS_NET_BIND_TCP | LANDLOCK_ACCESS_NET_CONNECT_TCP,
};
int ruleset_fd = landlock_create_ruleset(&ruleset_attr, sizeof(ruleset_attr), 0);
if (ruleset_fd < 0) {
perror("landlock_create_ruleset");
return 1;
}
Then, allow read-only and execute rights to /usr:
struct landlock_path_beneath_attr usr_attr = {
.allowed_access = LANDLOCK_ACCESS_FS_READ_FILE | LANDLOCK_ACCESS_FS_READ_DIR | LANDLOCK_ACCESS_FS_EXECUTE
};
usr_attr.parent_fd = open("/usr", O_PATH | O_CLOEXEC);
if (usr_attr.parent_fd < 0) {
perror("open /usr");
close(ruleset_fd);
return 1;
}
if (landlock_add_rule(ruleset_fd, LANDLOCK_RULE_PATH_BENEATH, &usr_attr, 0) < 0) {
perror("landlock_add_rule (/usr)");
close(usr_attr.parent_fd);
close(ruleset_fd);
return 1;
}
close(usr_attr.parent_fd);
Then, allow read-only access to /etc/ssl/certs:
struct landlock_path_beneath_attr ssl_attr = {
.allowed_access = LANDLOCK_ACCESS_FS_READ_FILE | LANDLOCK_ACCESS_FS_READ_DIR
};
ssl_attr.parent_fd = open("/etc/ssl/certs", O_PATH | O_CLOEXEC);
if (ssl_attr.parent_fd < 0) {
perror("open /etc/ssl/certs");
close(ruleset_fd);
return 1;
}
if (landlock_add_rule(ruleset_fd, LANDLOCK_RULE_PATH_BENEATH, &ssl_attr, 0) < 0) {
perror("landlock_add_rule (/etc/ssl/certs)");
close(ssl_attr.parent_fd);
close(ruleset_fd);
return 1;
}
close(ssl_attr.parent_fd);
Next, ensure network control is supported by the kernel then allow only TCP port 443:
if (abi >= 4) {
struct landlock_net_port_attr net_attr = {
.allowed_access = LANDLOCK_ACCESS_NET_CONNECT_TCP,
.port = 443
};
if (landlock_add_rule(ruleset_fd, LANDLOCK_RULE_NET_PORT, &net_attr, 0) < 0) {
perror("landlock_add_rule (HTTPS only)");
close(ruleset_fd);
return 1;
}
}
Running ./landlock_tcp_bin curl https://8.8.8.8 TCP port 443:
<HTML><HEAD><meta http-equiv="content-type" content="text/html;charset=utf-8">
<TITLE>302 Moved</TITLE></HEAD><BODY>
<H1>302 Moved</H1>
The document has moved
<A HREF="https://dns.google/">here</A>.
</BODY></HTML>
Running ./landlock_tcp_bin curl http://1.1.1.1 TCP port 80:
curl: (7) Failed to connect to 1.1.1.1 port 80 after 0 ms: Could not connect to server
Running ./landlock_tcp_bin ls /etc
ls: cannot open directory '/etc': Permission denied
Let’s move on to some tools that can help with advanced monitoring and control or a kind of next-level firewalling.
bpf_send_signal() is a helper function that allows a eBPF program to send a Unix signal (e.g., SIGUSR1, SIGKILL, etc.) to the current process (the process that triggered execution of the BPF program). If an anomaly is detected (e.g., unauthorized file access, network connections, or excessive resource usage), the eBPF program can send a signal to terminate the offending process. bpf_send_signal_thread() helper function is similar to bpf_send_signal() except it will send a signal to thread corresponding to the current task.
bpf_send_signal has the following prototype:
static long (* const bpf_send_signal)(__u32 sig) = (void *) 109;
sys_ptrace is a system call in Linux and other Unix-like operating systems that allows one process (the tracer) to observe and control the execution of another process (the tracee). The following example, we attached kprobe to sys_ptrace syscall and monitor this call to only allow root (UID = 0) to call this syscall. If UID not zero (non-root user) hen the process will be terminated using bpf_send_signal() helper function.
#define __TARGET_ARCH_x86
#include <linux/bpf.h>
#include <bpf/bpf_helpers.h>
#define ALLOWED_UID 0
char LICENSE[] SEC("license") = "GPL";
SEC("kprobe/__x64_sys_ptrace")
int BPF_KPROBE__x64_sys_ptrace(void)
{
__u64 uid_gid = bpf_get_current_uid_gid();
__u32 uid = (__u32)uid_gid;
if (uid != ALLOWED_UID) {
bpf_printk("Unauthorized ptrace attempt by uid %d\n", uid);
bpf_send_signal(9);
}
return 0;
}
User-space code
#include <stdio.h>
#include <unistd.h>
#include <sys/resource.h>
#include <bpf/libbpf.h>
#include "signal_ptrace.skel.h"
static int libbpf_print_fn(enum libbpf_print_level level, const char *format, va_list args)
{
return vfprintf(stderr, format, args);
}
int main(int argc, char **argv)
{
struct signal_ptrace *skel;
int err;
libbpf_set_print(libbpf_print_fn);
skel = signal_ptrace__open();
if (!skel) {
fprintf(stderr, "Failed to open BPF skeleton\n");
return 1;
}
err = signal_ptrace__load(skel);
if (err) {
fprintf(stderr, "Failed to load and verify BPF skeleton\n");
goto cleanup;
}
err = signal_ptrace__attach(skel);
if (err) {
fprintf(stderr, "Failed to attach BPF skeleton\n");
goto cleanup;
}
printf("Successfully started! Please run `sudo cat /sys/kernel/debug/tracing/trace_pipe` "
"to see output of the BPF programs.\n");
for (;;) {
fprintf(stderr, ".");
sleep(1);
}
cleanup:
signal_ptrace__destroy(skel);
return -err;
}
Compile the code, then generate skeleton file , then compile the loader code. When trying to trigger ptrace syscall with a tool like strace
strace /usr/bin/ls
Killed
Viewing the trace pipe file sudo cat /sys/kernel/debug/tracing/trace_pipe will give similar output:
strace-3402 [001] ...21 16100.793628: bpf_trace_printk: Unauthorized ptrace attempt by uid 1000
Below is an example write-up that describes an imaginary privilege escalation scenario and shows the eBPF code that detects the specific syscall sequence (fork, setuid(0), and execve) to terminate the process.
Imagine an attacker attempts a privilege escalation by using the following assembly code to fork, set UID to 0, and finally execute /bin/bash to spawn a root shell:
section .data
cmd db "/bin/bash", 0
section .text
global _start
_start:
; Fork syscall
mov eax, 57
xor edi, edi
syscall
test eax, eax
jz child_process
; Parent process
; Setuid syscall
mov eax, 105
xor edi, edi
syscall
cmp eax, 0
jne exit_program
; Execve syscall
mov eax, 59
mov rdi, cmd
xor rsi, rsi
xor rdx, rdx
syscall
exit_program:
mov eax, 60
xor edi, edi
syscall
child_process:
; Child process
xor eax, eax
ret
First, we compile it using
nasm -f elf64 -o privilege_escalation.o privilege_escalation.asm
Then link it
ld -o privilege_escalation privilege_escalation.o`
We build an eBPF program that uses bpf_send_signal to monitor for a suspicious sequence of syscalls. If the program detects that a process has forked, then called setuid(0), and finally executed execve to run /bin/bash (spawning a root shell), it will immediately fire a signal to terminate that process.
#include "vmlinux.h"
#include <bpf/bpf_helpers.h>
#include <bpf/bpf_core_read.h>
struct {
__uint(type, BPF_MAP_TYPE_HASH);
__uint(max_entries, 1024);
__type(key, u32);
__type(value, u8);
} forks SEC(".maps");
struct {
__uint(type, BPF_MAP_TYPE_HASH);
__uint(max_entries, 1024);
__type(key, u32);
__type(value, u8);
} setuid SEC(".maps");
char LICENSE[] SEC("license") = "GPL";
SEC("tracepoint/syscalls/sys_enter_fork")
int trace_fork(struct trace_event_raw_sys_enter *ctx)
{
u32 pid = bpf_get_current_pid_tgid() >> 32;
u8 val = 1;
bpf_map_update_elem(&forks, &pid, &val, BPF_ANY);
bpf_printk("Fork detected: PID %d\n", pid);
return 0;
}
SEC("tracepoint/syscalls/sys_enter_setuid")
int trace_setuid(struct trace_event_raw_sys_enter *ctx)
{
u32 uid = ctx->args[0];
if (uid == 0) {
u32 pid = bpf_get_current_pid_tgid() >> 32;
u8 val = 1;
bpf_map_update_elem(&setuid, &pid, &val, BPF_ANY);
bpf_printk("Setuid detected: PID %d\n", pid);
}
return 0;
}
SEC("tracepoint/syscalls/sys_enter_execve")
int trace_execve(struct trace_event_raw_sys_enter *ctx)
{
u32 pid = bpf_get_current_pid_tgid() >> 32;
u8 *forked = bpf_map_lookup_elem(&forks, &pid);
u8 *priv = bpf_map_lookup_elem(&setuid, &pid);
if (forked && priv) {
bpf_printk("Privilege escalation detected: fork, setuid(0), execve, PID %d\n", pid);
bpf_send_signal(9);
}
return 0;
}
sudo ./privilege_escalation
priv-3654 [...] Fork detected: PID 3654
priv-3654 [...] Setuid detected: PID 3654
priv-3654 [...] Privilege escalation detected: fork, setuid(0), execve, PID 3654
Tetragon is an open-source tool that uses eBPF to monitor and control Linux systems. It tracks events like process execution, network connections, and file access in real time. You can write custom rules to filter these events, and it runs with very little performance impact. Although it works great with Kubernetes and container setups, it can secure any Linux system that supports eBPF. Its kernel-level enforcement can, for example, kill a process if it violates a rule, adding a strong layer of security. Tetragon can be installed from their website, consider download it to follow this part.
Tetragon works by using policies called TracingPolicies. These policies let you define exactly what kernel events to monitor and what actions to take when those events happen. You write rules in a policy that attach probes to kernel functions, filter events based on criteria like arguments or process IDs, and then enforce actions (for example, killing a process) if a rule is matched. This approach gives you fine-grained control over system security in real time. Let’s take a glimpse of what Tetragon can do.
A TracingPolicy is a YAML document that follows Kubernetes’ API conventions. Even if you’re running Tetragon on a CLI (non-Kubernetes) installation, the policy structure remains similar. At its simplest, a tracing policy must include:
API Version and Kind: This tells Tetragon which version of the API you’re using and what type of object you’re creating. For tracing policies, you typically use:
apiVersion: cilium.io/v1alpha1
kind: TracingPolicy
Metadata: Metadata includes a unique name for your policy.
metadata:
name: "example-policy"
Spec: The spec contains all the configuration details about what you want to trace and how. It’s where you define:
The hook point is the entry point where Tetragon attaches its BPF program. You have several options: kprobes, tracepoints, uprobes and lsmhooks.
Let’s say you want to monitor do_mkdirat kernel function. You would specify:
spec:
kprobes:
- call: "do_mkdirat"
syscall: false
args:
- index: 0
type: "int"
- index: 1
type: "filename"
- index: 2
type: "int"
What This Means:
do_mkdirat kernel function and it’s not a syscall.return flag to true, define a returnArg, and specify its type. This is useful when you want to track how a function completes.spec:
kprobes:
- call: "do_mkdirat"
syscall: false
return: true
args:
- index: 0
type: "int"
- index: 1
type: "filename"
- index: 2
type: "int"
returnArg:
index: 0
type: "int"
Selectors are the core of in-kernel filtering. They allow you to define conditions that must be met for the policy to apply and actions to be triggered. Within a selector, you can include one or more filters.
Each probe can contain up to 5 selectors and each selector can contain one or more filter. Below is a table summarizing the available filters, their definitions, and the operators they support:
| Filter Name | Definition | Operators |
|---|---|---|
| matchArgs | Filters on the value of function arguments. | Equal, NotEqual, Prefix, Postfix, Mask, GreaterThan (GT), LessThan (LT), SPort, NotSPort, SPortPriv, NotSPortPriv, DPort, NotDPort, DPortPriv, NotDPortPriv, SAddr, NotSAddr, DAddr, NotDAddr, Protocol, Family, State |
| matchReturnArgs | Filters based on the function’s return value. | Equal, NotEqual, Prefix, Postfix |
| matchPIDs | Filters on the host PID of the process. | In, NotIn |
| matchBinaries | Filters on the binary path (or name) of the process invoking the event. | In, NotIn, Prefix, NotPrefix, Postfix, NotPostfix |
| matchNamespaces | Filters based on Linux namespace values. | In, NotIn |
| matchCapabilities | Filters based on Linux capabilities in the specified set (Effective, Inheritable, or Permitted). | In, NotIn |
| matchNamespaceChanges | Filters based on changes in Linux namespaces (e.g., when a process changes its namespace). | In |
| matchCapabilityChanges | Filters based on changes in Linux capabilities (e.g., when a process’s capabilities are altered). | In |
| matchActions | Applies an action when the selector matches (executed directly in kernel BPF code or in userspace for some actions). | Not a traditional filter; supports action types such as: Sigkill, Signal, Override, FollowFD, UnfollowFD, CopyFD, GetUrl, DnsLookup, Post, NoPost, TrackSock, UntrackSock, NotifyEnforcer. |
| matchReturnActions | Applies an action based on the return value matching the selector. | Similar to matchActions; supports action types (as above) that are executed on return events. |
matchArgs: Filter on a specific argument’s value (if filename = /etc/passwd)
selectors:
- matchArgs:
- index: 1
operator: "Equal"
values:
- "/etc/shadow"
matchBinaries: Filters based on the binary path or name of the process invoking the function.
- matchBinaries:
- operator: "In"
values:
- "/usr/bin/sudo"
- "/usr/bin/su"
Imagine you want to monitor any process that tries to open the file /etc/shadow or /etc/passwd. You might set up a selector that uses matchArgs filter:
spec:
kprobes:
- call: "sys_openat"
syscall: true
args:
- index: 0
type: int
- index: 1
type: "string"
- index: 2
type: "int"
selectors:
- matchArgs:
- index: 1
operator: "Equal"
values:
- "/etc/passwd"
- "/etc/shadow"
First, filter on the second parameter (index=1), then match it with (/etc/passwd or /etc/shadow).
__x64_sys_openat you can just use sys_openat and Tetragon will take care of the prefix of the syscall based on the architecture of you machine.
matchActions and matchReturnActions: These attach actions to be executed when the selector matches. They also allow you to filter based on the value of return arguments (if needed).
Actions are what your policy does when a selector matches. They allow you to enforce decisions right in the kernel. Some common actions include:
Sigkill and Signal: immediately terminates the offending process.
matchActions:
- action: Sigkill
To send a specific signal (e.g., SIGKILL which is signal 9)
matchActions:
- action: Signal
argSig:
Override: Modifies the return value of a function, which can cause the caller to receive an error code. This action uses the error injection framework.
- matchActions:
- action: Override
argError: -1
CONFIG_BPF_KPROBE_OVERRIDE option. There is a list of all function that support override and they are tagged with ALLOW_ERROR_INJECTION and they are located at /sys/kernel/debug/error_injection/list.
FollowFD, UnfollowFD and CopyFD: These actions help track file descriptor usage. For example, you can map a file descriptor to a file name during an open call, so that later calls (e.g., sys_write) that only have an FD can be correlated to a file path. The best example to explain FollowFD / UnfollowFD is from Tetragon documentation. This example is how to prevent write to a specific files for example /etc/passwd. sys_write only takes a file descriptor not a name and location. First we hook to fd_install kernel function.
fd_install is a kernel function that’s called when a file descriptor is being added to a process’s file descriptor table. In simpler terms, when a process opens a file (or performs a similar operation that creates a file descriptor), fd_install is invoked to associate the new file descriptor (an integer) with the corresponding file object. fd_install has the following prototype:
void fd_install(unsigned int fd, struct file *file);
FollowFD, UnfollowFD and CopyFD starting from Tetragon version 1.5 due to security concerns.
kprobes:
- call: "fd_install"
syscall: false
args:
- index: 0
type: int
- index: 1
type: "file"
selectors:
- matchArgs:
- index: 1
operator: "Equal"
values:
- "/etc/passwd"
matchActions:
- action: FollowFD
argFd: 0
argName: 1
- call: "sys_write"
syscall: true
args:
- index: 0
type: "fd"
- index: 1
type: "char_buf"
sizeArgIndex: 3
- index: 2
type: "size_t"
selectors:
- matchArgs:
- index: 0
operator: "Equal"
values:
- "/etc/passwd"
matchActions:
- action: Sigkill
- call: "sys_close"
syscall: true
args:
- index: 0
type: "int"
selectors:
- matchActions:
- action: UnfollowFD
argFd: 0
argName: 0
In the previous example, the second argument is defined as file type as the name of the kernel data structure struct file:
- index: 1
type: "file"
Post: Sends an event up to user space. You can also ask for kernel and user stack traces to be included, and even limit how often these events fire.
selectors:
- matchArgs:
- index: 1
operator: "Equal"
values:
- "/etc/passwd"
matchActions:
- action: Post
rateLimit: 5m
kernelStackTrace: true
userStackTrace: true
GetUrl and DnsLookup: The GetUrl action triggers an HTTP GET request to a specified URLargUrl. The DnsLookup action initiates a DNS lookup for a specified fully qualified domain name (FQDN) argFqdn.
Both actions are used to notify external systems when a specific event occurs in the kernel such as (Thinkst canaries or webhooks).
matchActions:
- action: GetUrl
argUrl: http://example.com/trigger
matchActions:
- action: DnsLookup
argFqdn: canary.example.com
Below is a complete tracing policy example that monitors when mkdir attempts to create test. When it does, the policy sends a SIGKILL signal to the offending process.
apiVersion: cilium.io/v1alpha1
kind: TracingPolicy
metadata:
name: "kill-mkdir-test"
spec:
kprobes:
- call: "do_mkdirat"
syscall: false
args:
- index: 0
type: "int"
- index: 1
type: "filename"
- index: 2
type: "int"
selectors:
- matchArgs:
- index: 1
operator: "Equal"
values:
- "test"
matchActions:
- action: Sigkill
Running this policy using sudo tetragon --tracing-policy mkdir.yaml. Output can be monitored using sudo tetra getevents -o compact
process mac-Standard-PC-Q35-ICH9-2009 /usr/bin/mkdir ../tmp/test
syscall mac-Standard-PC-Q35-ICH9-2009 /usr/bin/mkdir do_mkdirat
exit mac-Standard-PC-Q35-ICH9-2009 /usr/bin/mkdir ../tmp/test SIGKILL
Another example for blocking reading files from a specific directory using file_open hook in LSM:
apiVersion: cilium.io/v1alpha1
kind: TracingPolicy
metadata:
name: "Block-screct-files"
spec:
lsmhooks:
- hook: "file_open"
args:
- index: 0
type: "file"
selectors:
- matchArgs:
- index: 0
operator: "Prefix"
values:
- "/tmp/secret/"
matchActions:
- action: Sigkill
process mac-Standard-PC-Q35-ICH9-2009 /usr/bin/cat /tmp/secret/test1
LSM mac-Standard-PC-Q35-ICH9-2009 /usr/bin/cat file_open
exit mac-Standard-PC-Q35-ICH9-2009 /usr/bin/cat /tmp/secret/test1 SIGKILL
We can specify a specific binary to block. For example, to block only cat command:
selectors:
- matchBinaries:
- operator: "In"
values:
- "/usr/bin/cat"
matchArgs:
- index: 0
operator: "Prefix"
values:
- "/tmp/secret/"
Another example to block wget command from accessing port 443. We used DPort to define destination port:
apiVersion: cilium.io/v1alpha1
kind: TracingPolicy
metadata:
name: "block-443-for-wget"
spec:
kprobes:
- call: "tcp_connect"
syscall: false
args:
- index: 0
type: "sock"
selectors:
- matchBinaries:
- operator: "In"
values:
- "/usr/bin/wget"
matchArgs:
- index: 0
operator: "DPort"
values:
- 443
matchActions:
- action: Sigkill
wget command is blocked while curl command is working!
process mac-Standard-PC-Q35-ICH9-2009 /usr/bin/wget https://8.8.8.8
connect mac-Standard-PC-Q35-ICH9-2009 /usr/bin/wget tcp 192.168.122.215:60914 -> 8.8.8.8:443
exit mac-Standard-PC-Q35-ICH9-2009 /usr/bin/wget https://8.8.8.8 SIGKILL
process mac-Standard-PC-Q35-ICH9-2009 /usr/bin/curl https://8.8.8.8
exit mac-Standard-PC-Q35-ICH9-2009 /usr/bin/curl https://8.8.8.8 0
Example for monitoring sudo command using __sys_setresuid kernel function.
__sys_setresuid is the kernel function that implements the setresuid system call. It changes a process’s user IDs—specifically, the real, effective, and saved user IDs—in one atomic operation and it’s used to adjust process privileges.
apiVersion: cilium.io/v1alpha1
kind: TracingPolicy
metadata:
name: "detect-sudo"
spec:
kprobes:
- call: "__sys_setresuid"
syscall: false
args:
- index: 0
type: "int"
- index: 1
type: "int"
- index: 2
type: "int"
selectors:
- matchArgs:
- index: 1
operator: "Equal"
values:
- "0"
Tetragon can be configured to send metrics to Prometheus to monitor activities observed by Tetragon. It has also Elastic integration. Tetragon has policy library and many useful use cases in their documentation. It’s a powerful tool and even fun to try it.
bpfilter is a eBPF-based packet filtering currently maintained by meta, designed to replace or complement traditional packet filtering systems such as netfilter/iptables. It leverages the power of eBPF programs to implement filtering directly in the kernel. bpfilter is part of a broader shift towards eBPF-driven networking, moving away from older, monolithic approaches with minimal overhead.
bpfilter consists of two parts: daemon and front-ends. Font-end such as bfcli which receives firewall rules from administrators and send them to the daemon (bpfilter). bpfilter daemon parses the ruleset whether provided directly as a string or loaded from a file and then translates these high-level rules into eBPF bytecode that can be executed in the kernel.
bpfilter attaches the generated eBPF programs to specific kernel hooks such as XDP, TC (Traffic Control), or netfilter hooks (like NF_PRE_ROUTING, NF_LOCAL_IN, etc.). Each hook corresponds to a different stage in the packet processing pipeline, allowing bpfilter to intercept packets as early or as late as necessary.
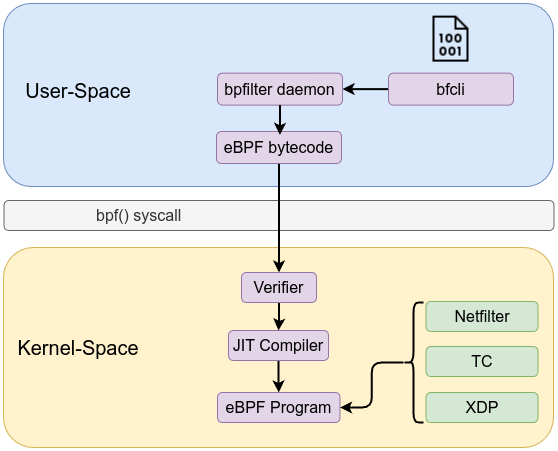
Follow the following instructions to install bpfilter on ubuntu 24.04/ debian 13. Install dependencies:
sudo apt install bison clang-format clang-tidy cmake doxygen flex furo git lcov libbpf-dev libcmocka-dev libbenchmark-dev libgit2-dev libnl-3-dev python3-breathe python3-pip python3-sphinx pkgconf
Download bpfilter:
git clone https://github.com/facebook/bpfilter.git
Make bpfilter:
cd bpfilter/
export SOURCES_DIR=$(pwd)
export BUILD_DIR=$SOURCES_DIR/build
cmake -S $SOURCES_DIR -B $BUILD_DIR
make -C $BUILD_DIR
iptables and nftables and supply your rules in either iptables syntax or nftables syntax such dropping incoming ICMP with iptables using --bpf flag as the following:sudo ./iptables --bpf -D INPUT -p icmp -j DROP
Follow the following instructions to install the custom iptables and nftables on ubuntu 24.04
Install dependencies:
sudo apt install autoconf libtool libmnl-dev libnftnl-dev libgmp-dev libedit-dev
Make the custom iptables and nftables:
make -C $BUILD_DIR nftables iptables
A bpfilter ruleset is defined using chains and rules with the following structure:
chain $HOOK policy $POLICY
rule
$MATCHER
$VERDICT
[...]
[...]
chain $HOOK policy $POLICY
$HOOK: The kernel hook where the chain is attached. The following list is from bpfilter documentation:
BF_HOOK_XDP: XDP hook.
BF_HOOK_TC_INGRESS: ingress TC hook.
BF_HOOK_NF_PRE_ROUTING: similar to nftables and iptables prerouting hook.
BF_HOOK_NF_LOCAL_IN: similar to nftables and iptables input hook.
BF_HOOK_CGROUP_INGRESS: ingress cgroup hook.
BF_HOOK_CGROUP_EGRESS: egress cgroup hook.
BF_HOOK_NF_FORWARD: similar to nftables and iptables forward hook.
BF_HOOK_NF_LOCAL_OUT: similar to nftables and iptables output hook.
BF_HOOK_NF_POST_ROUTING: similar to nftables and iptables postrouting hook.
BF_HOOK_TC_EGRESS: egress TC hook.
$POLICY: The default action (typically ACCEPT or DROP) applied to packets that do not match any rule in the chain.
Rule: Each rule under the chain consists of one or more matchers followed by a verdict.
$MATCHER: A condition (or multiple conditions) that compares parts of the packet. For example, checking the protocol or matching an IP address.
$VERDICT: The action to take if the matchers are true. Common verdicts are:
ACCEPT: Let the packet continue through the network stack.DROP: Discard the packet.CONTINUE: Continue to the next rule (often used in conjunction with packet counting).The following tables are from the bpfilter documentation and they contain detailed information about the various matchers used in bpfilter for filtering network traffic. Each table lists the matcher name (the field of the packet), its corresponding type in bpfilter (for example, udp.sport or tcp.sport), the operator used for comparison (such as eq, not, or range), the payload (the value or range to compare against), and additional notes that explain usage constraints or default behaviors.
| Matches | Type | Operator | Payload | Notes |
|---|---|---|---|---|
| Interface index | meta.ifindex |
eq | $IFINDEX |
For chains attached to an ingress hook, $IFINDEX is the input interface index. For chains attached to an egress hook, $IFINDEX is the output interface index. |
| L3 protocol | meta.l3_proto |
eq | $PROTOCOL |
ipv4 and ipv6 are supported. |
| L4 protocol | meta.l4_proto |
eq | $PROTOCOL |
icmp, icmpv6, tcp, udp are supported. |
| Source port | meta.sport |
eq | $PORT |
$PORT is a valid port value, as a decimal integer. |
| Source port | meta.sport |
not | $PORT |
$PORT is a valid port value, as a decimal integer. (Same payload and note as above) |
| Source port | meta.sport |
range | $START-$END |
$START and $END are valid port values, as decimal integers. |
| Destination port | meta.dport |
eq | $PORT |
$PORT is a valid port value, as a decimal integer. |
| Destination port | meta.dport |
not | $PORT |
$PORT is a valid port value, as a decimal integer. (Same payload and note as above) |
| Destination port | meta.dport |
range | $START-$END |
$START and $END are valid port values, as decimal integers. |
| Matches | Type | Operator | Payload | Notes |
|---|---|---|---|---|
| Source address | ip4.saddr |
eq | $IP/$MASK |
/$MASK is optional, /32 is used by default. |
| Source address | ip4.saddr |
not | $IP/$MASK |
/$MASK is optional, /32 is used by default. |
| Source address | ip4.saddr |
in | {$IP[,...]} |
Only support /32 mask. |
| Destination address | ip4.daddr |
eq | $IP/$MASK |
/$MASK is optional, /32 is used by default. |
| Destination address | ip4.daddr |
not | $IP/$MASK |
/$MASK is optional, /32 is used by default. |
| Destination address | ip4.daddr |
in | {$IP[,...]} |
Only support /32 mask. |
| Protocol | ip4.proto |
eq | $PROTOCOL |
Only icmp is supported for now, more protocols will be added. |
| Matches | Type | Operator | Payload | Notes |
|---|---|---|---|---|
| Source address | ip6.saddr |
eq | $IP/$PREFIX |
/$PREFIX is optional, /128 is used by default. |
| Source address | ip6.saddr |
not | $IP/$PREFIX |
/$PREFIX is optional, /128 is used by default. |
| Destination address | ip6.daddr |
eq | $IP/$PREFIX |
/$PREFIX is optional, /128 is used by default. |
| Destination address | ip6.daddr |
not | $IP/$PREFIX |
/$PREFIX is optional, /128 is used by default. |
| Matches | Type | Operator | Payload | Notes |
|---|---|---|---|---|
| Source port | tcp.sport |
eq | $PORT |
$PORT is a valid port value, as a decimal integer. |
| Source port | tcp.sport |
not | $PORT |
$PORT is a valid port value, as a decimal integer. |
| Source port | tcp.sport |
range | $START-$END |
$START and $END are valid port values, as decimal integers. |
| Destination port | tcp.dport |
eq | $PORT |
$PORT is a valid port value, as a decimal integer. |
| Destination port | tcp.dport |
not | $PORT |
$PORT is a valid port value, as a decimal integer. |
| Destination port | tcp.dport |
range | $START-$END |
$START and $END are valid port values, as decimal integers. |
| Flags | tcp.flags |
eq | $FLAGS |
$FLAGS is a comma-separated list of capitalized TCP flags (FIN, RST, ACK, ECE, SYN, PSH, URG, CWR). |
| Flags | tcp.flags |
not | $FLAGS |
$FLAGS is a comma-separated list of capitalized TCP flags (FIN, RST, ACK, ECE, SYN, PSH, URG, CWR). |
| Flags | tcp.flags |
any | $FLAGS |
$FLAGS is a comma-separated list of capitalized TCP flags (FIN, RST, ACK, ECE, SYN, PSH, URG, CWR). |
| Flags | tcp.flags |
all | $FLAGS |
$FLAGS is a comma-separated list of capitalized TCP flags (FIN, RST, ACK, ECE, SYN, PSH, URG, CWR). |
| Matches | Type | Operator | Payload | Notes |
|---|---|---|---|---|
| Source port | udp.sport |
eq | $PORT |
$PORT is a valid port value, as a decimal integer. |
| Source port | udp.sport |
not | $PORT |
$PORT is a valid port value, as a decimal integer. |
| Source port | udp.sport |
range | $START-$END |
$START and $END are valid port values, as decimal integers. |
| Destination port | udp.dport |
eq | $PORT |
$PORT is a valid port value, as a decimal integer. |
| Destination port | udp.dport |
not | $PORT |
$PORT is a valid port value, as a decimal integer. |
| Destination port | udp.dport |
range | $START-$END |
$START and $END are valid port values, as decimal integers. |
Let’s explore some examples and how to write bpfilter rules. First, start the daemon:
sudo build/output/sbin/bpfilter
info : no serialized context found on disk, a new context will be created
info : waiting for requests...
--transient marks the bpfilter ruleset as temporary, meaning it will be removed on daemon restart.
You can use either iptables or nftables as the following:
sudo build/tools/install/sbin/./iptables --bpf {Rule}
or
sudo build/tools/install/sbin/./nft --bpf {Rule}
As the previous example which blocks ICMP with bpfilter but using custom iptables as front-end:
sudo build/tools/install/sbin/./iptables --bpf -D INPUT -p icmp -j DROP
Let’s write rules with bfcli. Let’s start with create a simple rule by creating a chain on the TC ingress hook for interface index 2 with a default ACCEPT policy, and it adds a rule to drop any packets where the IPv4 protocol is ICMP:
sudo build/output/sbin/./bfcli ruleset set --str "chain BF_HOOK_TC_INGRESS{ifindex=2} policy ACCEPT rule ip4.proto eq icmp DROP"
You can use XDP instead on the previous rule. It’s all dependent on where in the kernel you want to apply your filter:
"chain BF_HOOK_XDP{ifindex=2} policy ACCEPT rule ip4.proto eq icmp DROP"
Flushing bpfilter is by using:
sudo build/output/sbin/./bfcli ruleset flush
Blocking egress traffic to 192.168.1.24 port 22 on TC egress hook
"chain BF_HOOK_TC_EGRESS{ifindex=2} policy ACCEPT rule ip4.daddr eq 192.168.1.24 tcp.dport eq 22 DROP"
Dropping packets that have both SYN and FIN flags set that’s not normally seen in legitimate traffic as it used by attackers as part of system discovery:
"chain BF_HOOK_TC_INGRESS{ifindex=2} policy ACCEPT rule tcp.flags all SYN,FIN DROP"
bpftrace is a powerful, high-level tracing language for Linux that simplifies the process of creating eBPF (Extended Berkeley Packet Filter) programs. It simplifies the process of instrumenting kernel and user-space code by providing a simple language to attach probes to kernel functions, tracepoints, and user-defined events in a user-friendly syntax, inspired by awk, C, and other tracing tools, enabling users to quickly gain insights into system behavior. By abstracting away the complexities of low-level eBPF programming and leveraging libbpf as its backend, bpftrace allows system administrators, performance engineers, and developers to easily observe and analyze system performance without requiring extensive eBPF expertise. Let’s start by looking at the bpftrace command.
When running bpftrace, you can use various command-line options to control its behavior. Some commonly used options include:
OPTIONS:
-B MODE output buffering mode ('full', 'none')
-f FORMAT output format ('text', 'json')
-o file redirect bpftrace output to file
-e 'program' execute this program
-h, --help show this help message
-I DIR add the directory to the include search path
--include FILE add an #include file before preprocessing
-l [search|filename]
list kernel probes or probes in a program
-p PID enable USDT probes on PID
-c 'CMD' run CMD and enable USDT probes on resulting process
--usdt-file-activation
activate usdt semaphores based on file path
--unsafe allow unsafe/destructive functionality
-q keep messages quiet
--info Print information about kernel BPF support
-k emit a warning when a bpf helper returns an error (except read functions)
-kk check all bpf helper functions
-V, --version bpftrace version
--no-warnings disable all warning messages
For example, we can use -l along with * for wildcard for listing such as listing all kprobes:
sudo bpftrace -l 'kprobe:*'
[...]
kprobe:zswap_store
kprobe:zswap_swapoff
kprobe:zswap_swapon
kprobe:zswap_total_pages
kprobe:zswap_writeback_entry
kprobe:zswap_writeback_show
kprobe:zswap_writeback_write
kprobe:zswap_zpool_param_set
We can list probe parameters for a certain function using
sudo bpftrace -lv 'fentry:tcp_reset'
fentry:vmlinux:tcp_reset
struct sock * sk
struct sk_buff * skb
We can list all symbols from object or binary files for uprobe such as the following:
sudo bpftrace -l 'uprobe:/bin/bash:*'
[...]
uprobe:/bin/bash:async_redirect_stdin
uprobe:/bin/bash:base_pathname
uprobe:/bin/bash:bash_add_history
uprobe:/bin/bash:bash_brace_completion
uprobe:/bin/bash:bash_clear_history
uprobe:/bin/bash:bash_default_completion
uprobe:/bin/bash:bash_delete_histent
uprobe:/bin/bash:bash_delete_history_range
uprobe:/bin/bash:bash_delete_last_history
uprobe:/bin/bash:bash_dequote_text
[...]
Using -e can be used to execute a program in one-liner. For example,
sudo bpftrace -e 'uprobe:/bin/bash:shell_execve { printf("shell_execve called\n"); }'
Attaching 1 probe...
open() called
open() called
open() called
This program uprobe:/bin/bash:shell_execve { printf("shell_execve called\n"); } means this action printf("shell_execve called\n"); will be executed when uprobe:/bin/bash:shell_execve get triggered.
If we want to print out which command is being executed is by printing the first argument with arg0 using str function which reads a NULL terminated string similar to bpf_probe_read_str helper function. argN is a bpf builtins while hold arguments passed to the function being traced and it can be used with kprobe and uprobe.
sudo bpftrace -e 'uprobe:/bin/bash:shell_execve { printf("command:%s\n", str(arg0)); }'
Attaching 1 probe...
command:/usr/bin/ls
command:/usr/bin/ping
command:/usr/bin/cat
The following table is from the bpftrace manual, listing special variables along with their corresponding helper functions and descriptions.
| Variable | BPF Helper | Description |
|---|---|---|
$1, $2, ...$n |
n/a | The nth positional parameter passed to the bpftrace program. If less than n parameters are passed this evaluates to 0. For string arguments use the str() call to retrieve the value. |
$# |
n/a | Total amount of positional parameters passed. |
arg0, arg1, ...argn |
n/a | nth argument passed to the function being traced. These are extracted from the CPU registers. The amount of args passed in registers depends on the CPU architecture. (kprobes, uprobes, usdt). |
args |
n/a | The struct of all arguments of the traced function. Available in tracepoint, fentry, fexit, and uprobe (with DWARF) probes. Use args.x to access argument x or args to get a record with all arguments. |
cgroup |
get_current_cgroup_id | ID of the cgroup the current process belongs to. Only works with cgroupv2. |
comm |
get_current_comm | Name of the current thread. |
cpid |
n/a | Child process ID, if bpftrace is invoked with -c. |
cpu |
raw_smp_processor_id | ID of the processor executing the BPF program. |
curtask |
get_current_task | Pointer to struct task_struct of the current task. |
elapsed |
ktime_get_ns / ktime_get_boot_ns | Nanoseconds elapsed since bpftrace initialization, based on nsecs. |
func |
n/a | Name of the current function being traced (kprobes, uprobes). |
gid |
get_current_uid_gid | Group ID of the current thread, as seen from the init namespace. |
jiffies |
get_jiffies_64 | Jiffies of the kernel. In 32-bit systems, using this builtin might be slower. |
numaid |
numa_node_id | ID of the NUMA node executing the BPF program. |
pid |
get_current_pid_tgid | Process ID of the current thread (aka thread group ID), as seen from the init namespace. |
probe |
n/a | Name of the current probe. |
rand |
get_prandom_u32 | Random number. |
return |
n/a | The return keyword is used to exit the current probe. This differs from exit() in that it doesn’t exit bpftrace. |
retval |
n/a | Value returned by the function being traced (kretprobe, uretprobe, fexit). For kretprobe and uretprobe, its type is uint64, but for fexit it depends. You can look up the type using bpftrace -lv. |
tid |
get_current_pid_tgid | Thread ID of the current thread, as seen from the init namespace. |
uid |
get_current_uid_gid | User ID of the current thread, as seen from the init namespace. |
The following table is from the bpftrace manual, listing bpftrace functions along with their corresponding descriptions.
| Name | Description |
|---|---|
| bswap | Reverse byte order |
| buf | Returns a hex-formatted string of the data pointed to by d |
| cat | Print file content |
| cgroupid | Resolve cgroup ID |
| cgroup_path | Convert cgroup id to cgroup path |
| exit | Quit bpftrace with an optional exit code |
| join | Print the array |
| kaddr | Resolve kernel symbol name |
| kptr | Annotate as kernelspace pointer |
| kstack | Kernel stack trace |
| ksym | Resolve kernel address |
| len | Count ustack/kstack frames |
| macaddr | Convert MAC address data |
| nsecs | Timestamps and Time Deltas |
| ntop | Convert IP address data to text |
| offsetof | Offset of element in structure |
| override | Override return value |
| path | Return full path |
| percpu_kaddr | Resolve percpu kernel symbol name |
| Print a non-map value with default formatting | |
| printf | Print formatted |
| pton | Convert text IP address to byte array |
| reg | Returns the value stored in the named register |
| signal | Send a signal to the current process |
| sizeof | Return size of a type or expression |
| skboutput | Write skb ’s data section into a PCAP file |
| str | Returns the string pointed to by s |
| strcontains | Compares whether the string haystack contains the string needle. |
| strerror | Get error message for errno code |
| strftime | Return a formatted timestamp |
| strncmp | Compare first n characters of two strings |
| system | Execute shell command |
| time | Print formatted time |
| uaddr | Resolve user-level symbol name |
| uptr | Annotate as userspace pointer |
| ustack | User stack trace |
| usym | Resolve user space address |
bpftrace scripts are written using a custom domain-specific language (DSL) that is similar in syntax to awk. A basic script consists of one or more probe definitions followed by one or more actions. Each probe targets a specific event (e.g., kernel tracepoints, function entry/exit, or user-space events).
The following table is from the bpftrace manual, listing bpftrace probes along with their corresponding descriptions.
| Probe Name | Short Name | Description | Kernel/User Level |
|---|---|---|---|
| BEGIN/END | - | Built-in events | Kernel/User |
| self | - | Built-in events | Kernel/User |
| hardware | h |
Processor-level events | Kernel |
| interval | i |
Timed output | Kernel/User |
| iter | it |
Iterators tracing | Kernel |
| fentry/fexit | f/fr |
Kernel functions tracing with BTF support | Kernel |
| kprobe/kretprobe | k/kr |
Kernel function start/return | Kernel |
| profile | p |
Timed sampling | Kernel/User |
| rawtracepoint | rt |
Kernel static tracepoints with raw arguments | Kernel |
| software | s |
Kernel software events | Kernel |
| tracepoint | t |
Kernel static tracepoints | Kernel |
| uprobe/uretprobe | u/ur |
User-level function start/return | User |
| usdt | U |
User-level static tracepoints | User |
| watchpoint/asyncwatchpoint | w/aw |
Memory watchpoints | Kernel |
probe_type:probe_identifier
{
// Action code block
printf("Hello, world!\n");
}
For example, to print a message every time a process calls the unlinkat() syscall, you might write:
#!/usr/bin/env bpftrace
tracepoint:syscalls:sys_enter_unlinkat
{
printf("unlinkat syscall invoked\n");
}
sys_enter_unlinkat tracepoint’s arguments can be listed from /sys/kernel/debug/tracing/events/syscalls/sys_enter_unlinkat/format
name: sys_enter_unlinkat
ID: 849
format:
field:unsigned short common_type; offset:0; size:2; signed:0;
field:unsigned char common_flags; offset:2; size:1; signed:0;
field:unsigned char common_preempt_count; offset:3; size:1; signed:0;
field:int common_pid; offset:4; size:4; signed:1;
field:int __syscall_nr; offset:8; size:4; signed:1;
field:int dfd; offset:16; size:8; signed:0;
field:const char * pathname; offset:24; size:8; signed:0;
field:int flag; offset:32; size:8; signed:0;
print fmt: "dfd: 0x%08lx, pathname: 0x%08lx, flag: 0x%08lx", ((unsigned long)(REC->dfd)), ((unsigned long)(REC->pathname)), ((unsigned long)(REC->flag))
Therefore, we can use str(args.pathname) to extract the name of the file being deleted. args is one of the bpftrace builtins which is a data struct of all arguments of the traced function and it can be used with tracepoint, fentry, fexit.
#!/usr/bin/env bpftrace
tracepoint:syscalls:sys_enter_unlinkat
{
printf("Process %s (PID: %d) is deleting a file %s\n", comm, pid, str(args.pathname));
}
Attaching 1 probe...
Process rm (PID: 2269) is deleting a file test1
Process rm (PID: 2270) is deleting a file test2
Let’s convert this eBPF kernel code to bpftrace
#define __TARGET_ARCH_x86
#include "vmlinux.h"
#include <bpf/bpf_helpers.h>
#include <bpf/bpf_tracing.h>
#include <bpf/bpf_core_read.h>
struct event {
pid_t pid;
char filename[256];
umode_t mode;
};
struct {
__uint(type, BPF_MAP_TYPE_PERF_EVENT_ARRAY); // Type of BPF map
__uint(max_entries, 1024); // Maximum number of entries in the map
__type(key, int); // Type of the key
__type(value, int); // Type of the value
} mkdir SEC(".maps");
char LICENSE[] SEC("license") = "Dual BSD/GPL";
SEC("kprobe/do_mkdirat")
int BPF_KPROBE(do_mkdirat, int dfd, struct filename *name, umode_t mode)
{
pid_t pid = bpf_get_current_pid_tgid() >> 32;
struct event ev = {};
ev.pid = pid;
ev.mode = mode;
const char *filename = BPF_CORE_READ(name, name);
bpf_probe_read_str(ev.filename, sizeof(ev.filename), filename);
bpf_perf_event_output(ctx, &mkdir, BPF_F_CURRENT_CPU, &ev, sizeof(ev));
return 0;
}
Let’s build the same code without Maps as it will be explained shortly
#!/usr/bin/env bpftrace
kprobe:do_mkdirat
{
printf("PID: %d, mode: %d, filename: %s\n", pid, arg2, str(((struct filename *)arg1)->name));
}
The idea is to cast arg1 to a pointer to struct filename before accessing name field.
Maps in bpftrace are defined with @ such as @testmap. The following table is from bpftrace manual, listing bpftrace map functions along with their corresponding descriptions.
| Name | Description |
|---|---|
| avg | Calculate the running average of n between consecutive calls. |
| clear | Clear all keys/values from a map. |
| count | Count how often this function is called. |
| delete | Delete a single key from a map. |
| has_key | Return true (1) if the key exists in this map. Otherwise return false (0). |
| hist | Create a log2 histogram of n using buckets per power of 2, 0 <= k <= 5, defaults to 0. |
| len | Return the number of elements in a map. |
| lhist | Create a linear histogram of n. lhist creates M ((max - min) / step) buckets in the range [min, max) where each bucket is step in size. |
| max | Update the map with n if n is bigger than the current value held. |
| min | Update the map with n if n is smaller than the current value held. |
| stats | Combines the count, avg and sum calls into one. |
| sum | Calculate the sum of all n passed. |
| zero | Set all values for all keys to zero. |
#include "vmlinux.h"
#include <bpf/bpf_helpers.h>
#include <bpf/bpf_core_read.h>
struct {
__uint(type, BPF_MAP_TYPE_HASH);
__uint(max_entries, 1024);
__type(key, u32);
__type(value, u8);
} forks SEC(".maps");
struct {
__uint(type, BPF_MAP_TYPE_HASH);
__uint(max_entries, 1024);
__type(key, u32);
__type(value, u8);
} setuid SEC(".maps");
SEC("tracepoint/syscalls/sys_enter_fork")
int trace_fork(struct trace_event_raw_sys_enter *ctx)
{
u32 pid = bpf_get_current_pid_tgid() >> 32;
u8 val = 1;
bpf_map_update_elem(&forks, &pid, &val, BPF_ANY);
bpf_printk("Fork detected: PID %d\n", pid);
return 0;
}
SEC("tracepoint/syscalls/sys_enter_setuid")
int trace_setuid(struct trace_event_raw_sys_enter *ctx)
{
u32 uid = ctx->args[0];
if (uid == 0) {
u32 pid = bpf_get_current_pid_tgid() >> 32;
u8 val = 1;
bpf_map_update_elem(&setuid, &pid, &val, BPF_ANY);
bpf_printk("Setuid detected: PID %d\n", pid);
}
return 0;
}
SEC("tracepoint/syscalls/sys_enter_execve")
int trace_execve(struct trace_event_raw_sys_enter *ctx)
{
u32 pid = bpf_get_current_pid_tgid() >> 32;
u8 *forked = bpf_map_lookup_elem(&forks, &pid);
u8 *priv = bpf_map_lookup_elem(&setuid, &pid);
if (forked && priv) {
bpf_printk("Privilege escalation detected: fork, setuid(0), execve, PID %d\n", pid);
bpf_send_signal(9);
}
return 0;
}
char LICENSE[] SEC("license") = "GPL";
Let’s see the previous code in bpftrace:
#!/usr/bin/env bpftrace
tracepoint:syscalls:sys_enter_fork
{
@forks[pid] = 1;
printf("Fork detected: PID %d\n", pid);
}
tracepoint:syscalls:sys_enter_setuid
{
if (uid == 0)
{
@setuid[pid] = 1;
printf("Setuid detected: PID %d\n", pid);
}
}
tracepoint:syscalls:sys_enter_execve
{
if (@forks[pid] == 1 && @setuid[pid] == 1)
{
printf("Privilege escalation detected: fork, setuid(0), execve, PID %d\n", pid);
signal(9)
}
}
Define a map named forks, and when the sys_enter_setuid tracepoint is triggered, insert the current pid as the key with a value of 1.
@forks[pid] = 1;
Define a map named setuid, and when the sys_enter_fork tracepoint is triggered with a UID of zero, insert the current pid as the key and 1 as the value.
@setuid[pid] = 1;
If sys_enter_execve is triggered, then it will check if the current pid triggered by sys_enter_setuid and sys_enter_fork
if (@forks[pid] == 1 && @setuid[pid] == 1)
signal function is equivalent to bpf_send_signal helper function to terminate the process.
signal(9)
We have to run this code with --unsafe because we running dangerous function which is signal, then to run it sudo bpftrace --unsafe priv-esc.bt.
This code is much smaller and simpler than eBPF kernel code, and no need for user-space code.
The next script attaches probes to the sys_enter_read and sys_enter_write syscalls (separated with comma ,) and uses a map to count the number of system calls per process using count() map function.
#!/usr/bin/env bpftrace
tracepoint:syscalls:sys_enter_read,
tracepoint:syscalls:sys_enter_write
{
@syscalls[comm] = count();
}
interval:s:5 {
printf("\033[H\033[2J");
print(@syscalls);
}
This will activate every 5 seconds (using interval probe) to clear the screen using ANSI escape sequences printf("\033[H\033[2J");, then print the content of syscalls map.
interval:s:5 {
printf("\033[H\033[2J");
print(@syscalls);
}
@syscalls[systemd-timesyn]: 1
@syscalls[systemd-journal]: 1
@syscalls[systemd]: 4
@syscalls[rtkit-daemon]: 8
@syscalls[sudo]: 10
@syscalls[gnome-shell]: 13
@syscalls[gvfsd-wsdd]: 16
@syscalls[bash]: 20
@syscalls[ls]: 26
@syscalls[bpftrace]: 47
@syscalls[sshd-session]: 818
The following tools from bpftrace github repository. They cover a wide range of functions from tracing I/O and network events to monitoring process and syscall activity.
| Name | Description |
|---|---|
| bashreadline.bt | Print entered bash commands system wide. Examples. |
| biolatency.bt | Block I/O latency as a histogram. Examples. |
| biosnoop.bt | Block I/O tracing tool, showing per I/O latency. Examples. |
| biostacks.bt | Show disk I/O latency with initialization stacks. Examples. |
| bitesize.bt | Show disk I/O size as a histogram. Examples. |
| capable.bt | Trace security capability checks. Examples. |
| cpuwalk.bt | Sample which CPUs are executing processes. Examples. |
| dcsnoop.bt | Trace directory entry cache (dcache) lookups. Examples. |
| execsnoop.bt | Trace new processes via exec() syscalls. Examples. |
| gethostlatency.bt | Show latency for getaddrinfo/gethostbyname[2] calls. Examples. |
| killsnoop.bt | Trace signals issued by the kill() syscall. Examples. |
| loads.bt | Print load averages. Examples. |
| mdflush.bt | Trace md flush events. Examples. |
| naptime.bt | Show voluntary sleep calls. Examples. |
| opensnoop.bt | Trace open() syscalls showing filenames. Examples. |
| oomkill.bt | Trace OOM killer. Examples. |
| pidpersec.bt | Count new processes (via fork). Examples. |
| runqlat.bt | CPU scheduler run queue latency as a histogram. Examples. |
| runqlen.bt | CPU scheduler run queue length as a histogram. Examples. |
| setuids.bt | Trace the setuid syscalls: privilege escalation. Examples. |
| ssllatency.bt | Summarize SSL/TLS handshake latency as a histogram. Examples. |
| sslsnoop.bt | Trace SSL/TLS handshake, showing latency and return value. Examples. |
| statsnoop.bt | Trace stat() syscalls for general debugging. Examples. |
| swapin.bt | Show swapins by process. Examples. |
| syncsnoop.bt | Trace sync() variety of syscalls. Examples. |
| syscount.bt | Count system calls. Examples. |
| tcpaccept.bt | Trace TCP passive connections (accept()). Examples. |
| tcpconnect.bt | Trace TCP active connections (connect()). Examples. |
| tcpdrop.bt | Trace kernel-based TCP packet drops with details. Examples. |
| tcplife.bt | Trace TCP session lifespans with connection details. Examples. |
| tcpretrans.bt | Trace TCP retransmits. Examples. |
| tcpsynbl.bt | Show TCP SYN backlog as a histogram. Examples. |
| threadsnoop.bt | List new thread creation. Examples. |
| undump.bt | Capture UNIX domain socket packages. Examples. |
| vfscount.bt | Count VFS calls. Examples. |
| vfsstat.bt | Count some VFS calls, with per-second summaries. Examples. |
| writeback.bt | Trace file system writeback events with details. Examples. |
| xfsdist.bt | Summarize XFS operation latency distribution as a histogram. Examples. |
BCC in short is a toolkit that makes eBPF development easier by providing a higher-level interface. It compiles your eBPF C code at runtime to match the target kernel’s data structures. BCC works with languages like Python, Lua, and C++, and includes helpful macros and shortcuts for simpler programming. Essentially, BCC takes your eBPF program as a C string, preprocesses it, and then compiles it using clang.
The following is a crash course on BCC. I strongly recommend reading the BCC manual as well—it’s incredibly detailed and covers topics that are too extensive for this chapter.
kprobe__ followed by the name of kernel function name. For example, int kprobe__do_mkdirat(struct pt_regs *ctx). struct pt_regs *ctx as a context for kprobe. Arguments can be extracted using PT_REGS_PARM1(ctx), PT_REGS_PARM2(ctx), … macros.kretprobe__ followed by the name of kernel function name. For example, int kretprobe__do_mkdirat(struct pt_regs *ctx). Return value can be extracted using PT_REGS_RC(ctx) macro.int function(struct pt_regs *ctx). Arguments can be extracted using PT_REGS_PARM1(ctx), PT_REGS_PARM2(ctx), … macros.int function(struct pt_regs *ctx). Return value can be extracted using PT_REGS_RC(ctx) macro.TRACEPOINT_PROBE followed by (category, event) . For example, TRACEPOINT_PROBE(sched,sched_process_exit). Arguments are available in an args struct and you can list of argument from the format file. Foe example, args->pathname in case of TRACEPOINT_PROBE(syscalls, sys_enter_unlinkat).RAW_TRACEPOINT_PROBE(event).RAW_TRACEPOINT_PROBE(sys_enter). As stated before, raw tracepoint uses bpf_raw_tracepoint_args as context and it has args as args[0] -> points to pt_regs structure and args[1] is the syscall number. To access the target functions’ parameters, you can either cast ctx->args[0] to a pointer to a struct pt_regs and use it directly, or copy its contents into a local variable of type struct pt_regs (e.g., struct pt_regs regs;). Then, you can extract the syscall parameters using the PT_REGS_PARM macros (such as PT_REGS_PARM1, PT_REGS_PARM2, etc.). // Copy the pt_regs structure from the raw tracepoint args.
if (bpf_probe_read(®s, sizeof(regs), (void *)ctx->args[0]) != 0)
return 0;
// Get the second parameter (pathname) from the registers.
const char *pathname = (const char *)PT_REGS_PARM2(®s);
LSM_PROBE(hook_name,typeof(arg1), typeof(arg1)...). For example, to prevent creating a new directory:LSM_PROBE(path_mkdir, const struct path *dir, struct dentry *dentry, umode_t mode, int ret)
{
bpf_trace_printk("LSM path_mkdir: mode=%d, ret=%d\n", mode, ret);
return -1;
}
bpf_probe_read_kernel helper function with the following prototype:int bpf_probe_read_kernel(void *dst, int size, const void *src)
bpf_probe_read_kernel is used for copying arbitrary data (e.g., structures, buffers) from kernel space and returns 0 on success.
bpf_probe_read_kernel_str helper function with the following prototype:int bpf_probe_read_kernel_str(void *dst, int size, const void *src)
bpf_probe_read_kernel_str is used for reading null-terminated strings from kernel space and returns the length of the string including the trailing NULL on success.
bpf_probe_read_user helper function with the following prototype:int bpf_probe_read_user(void *dst, int size, const void *src)
bpf_probe_read_user is used for copying arbitrary data (e.g., structures, buffers) from user space and returns 0 on success.
bpf_probe_read_user_str helper function with the following prototype:int bpf_probe_read_user_str(void *dst, int size, const void *src)
bpf_probe_read_user_str is used for reading null-terminated strings from user space and returns the length of the string including the trailing NULL on success.
bpf_ktime_get_ns: returns u64 time elapsed since system boot in nanoseconds.bpf_get_current_pid_tgid: returns u64 current tgid and pid.bpf_get_current_uid_gid: returns u64 current pid and gid.bpf_get_current_comm(void *buf, __u32 size_of_buf): copy current process name into pointerbuf and sizeof at least 16 bytes.
For example: char comm[TASK_COMM_LEN]; // TASK_COMM_LEN = 16, defined in include/linux/sched.h
bpf_get_current_comm(&comm, sizeof(comm));
bpf_get_current_task helper function returns current task as a pointer to struct task_struct.BPF_PERF_OUTPUT(name): creates eBPF table to push data out to user-space using perf buffer.perf_submit: a method of a BPF_PERF_OUTPUT to submit data to user-space. The method perf_submit has the following prototype: int perf_submit((void *)ctx, (void *)data, u32 data_size).BPF_RINGBUF_OUTPUT: creates eBPF table to push data out to user-space using ring buffer. It has the following prototype BPF_RINGBUF_OUTPUT(name, page_cnt), page_cnt is number of memory pages for ring buffer size.ringbuf_output: a method of the BPF_RINGBUF_OUTPUT to submit data to user-space.ringbuf_output has the following prototype: int ringbuf_output((void *)data, u64 data_size, u64 flags).ringbuf_reserve: a method of the BPF_RINGBUF_OUTPUT to reserve a space in ring buffer and allocate data structure pointer for output data. It has the following prototype: void* ringbuf_reserve(u64 data_size).ringbuf_submit: a method of the BPF_RINGBUF_OUTPUT to submit data to user-space. ringbuf_submit has the following prototype: void ringbuf_submit((void *)data, u64 flags).BPF_HASH: creates hash map. For example, BPF_HASH(my_hash, u64, u64);.BPF_ARRAY: creates array map.BCC has also BPF_HISTOGRAM, BPF_STACK_TRACE, BPF_PERF_ARRAY, BPF_PERCPU_HASH, BPF_PERCPU_ARRAY, BPF_LPM_TRIE,BPF_PROG_ARRAY, BPF_CPUMAP, BPF_ARRAY_OF_MAPS and BPF_HASH_OF_MAPS.
*val map.lookup(&key): return a pointer to value if exists.map.delete(&key): delete a key from map.map.update(&key, &val): updates value for a given key.map.insert(&key, &val): inserts a value for a given key.map.increment(key[, increment_amount]): increments the value associated with key by increment_amount.BPF(text=prog): creates eBPF object.BPF.attach_kprobe(event="event", fn_name="name"): attach a probe into kernel function event and use name as kprobe handler.BPF.attach_kretprobe(event="event", fn_name="name"): behaves the same way as attach_kprobe.BPF.attach_tracepoint(tp="tracepoint", fn_name="name"): attach a probe into tracepoint and use name as tracepoint handler.BPF.attach_uprobe(name="location", sym="symbol", fn_name="name"): attach a probe tolocation with symboluse name as uprobe handler. For example,b.attach_uprobe(name="/bin/bash", sym="shell_execve", fn_name="bash_exec")
Attach a probe to shell_execve symbol in binary or object file/bin/bashand use bash_exec as a handler.
BPF.attach_uretprobe(name="location", sym="symbol", fn_name="name"): the same as attach_uprobe.BPF.attach_raw_tracepoint(tp="tracepoint", fn_name="name"): the same as attach_tracepoint.BPF.attach_xdp(dev="device", fn=b.load_func("fn_name",BPF.XDP), flags): attach XDP to device, use fn_name as handler for each ingress packet. Flags are defined in include/uapi/linux/if_link.h as the following:#define XDP_FLAGS_UPDATE_IF_NOEXIST (1U << 0) //-->
#define XDP_FLAGS_SKB_MODE (1U << 1)
#define XDP_FLAGS_DRV_MODE (1U << 2)
#define XDP_FLAGS_HW_MODE (1U << 3)
XDP_FLAGS_UPDATE_IF_NOEXIST (1U « 0): This flag attaches the XDP program if there isn’t already one present. XDP_FLAGS_SKB_MODE (1U « 1): This flag attaches the XDP program in generic mode. XDP_FLAGS_DRV_MODE (1U « 2): This flag attaches the XDP program in native driver mode. XDP_FLAGS_HW_MODE (1U « 3): This flag is used for offloading the XDP program to supported hardware (NICs that support XDP offload).
BPF.remove_xdp("device"): removes XDP program from interface device.BPF.detach_kprobe(event="event", fn_name="name"): detach a kprobe.BPF.detach_kretprobe(event="event", fn_name="name"): detach a kretprobe.BPF.perf_buffer_poll(timeout=T): polls data from perf buffer.BPF.ring_buffer_poll(timeout=T): polls data from ring buffer.table.open_perf_buffer(callback, page_cnt=N, lost_cb=None): opens a perf ring buffer for BPF_PERF_OUTPUT.table.open_ring_buffer(callback, ctx=None): opens a buffer ring specifically for BPF_RINGBUF_OUTPUT.BPF.trace_print: reads from /sys/kernel/debug/tracing/trace_pipe and prints the contents.Let’s look at example The following eBPF kernel code yo attack kprobe to do_mkdirat kernel function.
from bcc import BPF
prog = r"""
#include <uapi/linux/ptrace.h>
#include <linux/fs.h>
#define MAX_FILENAME_LEN 256
int kprobe__do_mkdirat(struct pt_regs *ctx)
{
pid_t pid = bpf_get_current_pid_tgid() >> 32;
char fname[MAX_FILENAME_LEN] = {};
struct filename *name = (struct filename *)PT_REGS_PARM2(ctx);
const char *name_ptr = 0;
bpf_probe_read(&name_ptr, sizeof(name_ptr), &name->name);
bpf_probe_read_str(fname, sizeof(fname), name_ptr);
umode_t mode = PT_REGS_PARM3(ctx);
bpf_trace_printk("KPROBE ENTRY pid = %d, filename = %s, mode = %u", pid, fname, mode);
return 0;
}
"""
b = BPF(text=prog)
print("Tracing mkdir calls... Hit Ctrl-C to exit.")
b.trace_print()
bpf_trace_printk function is similar to bpf_printk macro. First, we create an eBPF object from the C code using b = BPF(text=prog). We don’t have to add attach_kprobe because we followed the naming convention of kprobe which is kprobe__ followed by the name of kernel function name kprobe__do_mkdirat.
Run sudo python3 bcc-mkdir.py:
b' mkdir-1706 [...] KPROBE ENTRY pid = 1706, filename = test1, mode = 511'
b' mkdir-1708 [...] KPROBE ENTRY pid = 1708, filename = test2, mode = 511'
We don’t have to compile because BCC compiles eBPF C code at runtime and there is no need to write a separate user-space. If you notice, the previous code is exactly similar to the following:
#define __TARGET_ARCH_x86
#include "vmlinux.h"
#include <bpf/bpf_helpers.h>
#include <bpf/bpf_tracing.h>
#include <bpf/bpf_core_read.h>
char LICENSE[] SEC("license") = "GPL";
SEC("kprobe/do_mkdirat")
int kprobe_mkdir(struct pt_regs *ctx)
{
pid_t pid;
const char *filename;
umode_t mode;
pid = bpf_get_current_pid_tgid() >> 32;
    struct filename *name = (struct filename *)PT_REGS_PARM2(ctx);
    filename = BPF_CORE_READ(name, name);
mode = PT_REGS_PARM3(ctx);
bpf_printk("KPROBE ENTRY pid = %d, filename = %s, mode = %u\n", pid, filename,mode);
return 0;
}
Let’s explore another example which uses Tracepoints with ring buffer map.
from bcc import BPF
prog = """
struct event {
u32 pid;
char comm[16];
char filename[256];
};
BPF_RINGBUF_OUTPUT(events, 4096);
TRACEPOINT_PROBE(syscalls, sys_enter_unlinkat) {
struct event *evt = events.ringbuf_reserve(sizeof(*evt));
if (!evt)
return 0;
evt->pid = bpf_get_current_pid_tgid() >> 32;
bpf_get_current_comm(evt->comm, sizeof(evt->comm));
// In the tracepoint for unlinkat, the second argument (args->pathname) is the filename.
bpf_probe_read_user_str(evt->filename, sizeof(evt->filename), args->pathname);
events.ringbuf_submit(evt, 0);
return 0;
}
"""
def print_event(cpu, data, size):
event = b["events"].event(data)
print("PID: %d, COMM: %s, File: %s" %
(event.pid,
event.comm.decode('utf-8'),
event.filename.decode('utf-8')))
b = BPF(text=prog)
b["events"].open_ring_buffer(print_event)
print("Tracing unlinkat syscall... Hit Ctrl-C to end.")
while True:
try:
b.ring_buffer_poll(100)
except KeyboardInterrupt:
exit()
The print_event callback function to the ring buffer which will be called every time an event is received from the ring buffer. print_event takes cpu number, pointer to raw data of the event data structure defined in eBPF code and size of the event data.
def print_event(cpu, data, size):
Then, event is defined automatically using BCC from eBPF data structure event:
event = b["events"].event(data)
Then, printing out the contents of the event:
print("PID: %d, COMM: %s, File: %s" %
(event.pid,
event.comm.decode('utf-8'),
event.filename.decode('utf-8')))
Then,we create an eBPF object from the C code using b = BPF(text=prog). Then, we opened the ring buffer associated with the map named events with callback function (print_event) to process data that is submitted to the ring buffer.
b["events"].open_ring_buffer(print_event)
We don’t need to use BPF.attach_tracepoint because we followed the naming convention for tracepoints which is TRACEPOINT_PROBE(_category_, _event_). Finally, we start polling from the ring buffer with 100ms timeout.
b.ring_buffer_poll(100) # 100ms timeout
If you noticed, this code is similar to what we did in tracepoint.
#define __TARGET_ARCH_x86
#include "vmlinux.h"
#include <bpf/bpf_helpers.h>
#include <bpf/bpf_tracing.h>
#include <bpf/bpf_core_read.h>
struct event {
__u32 pid;
char comm[16];
char filename[256];
};
struct {
    __uint(type, BPF_MAP_TYPE_RINGBUF);
    __uint(max_entries, 4096);
} events SEC(".maps");
char _license[] SEC("license") = "GPL";
SEC("tracepoint/syscalls/sys_enter_unlinkat")
int trace_unlinkat(struct trace_event_raw_sys_enter* ctx) {
struct event *evt;
evt = bpf_ringbuf_reserve(&events, sizeof(struct event), 0);
if (!evt)
return 0;
evt->pid = bpf_get_current_pid_tgid() >> 32;
bpf_get_current_comm(&evt->comm, sizeof(evt->comm));
bpf_probe_read_user_str(&evt->filename, sizeof(evt->filename), (const char *)ctx->args[1]);
bpf_ringbuf_submit(evt, 0);
return 0;
}
The following tables are from the BCC GitHub repository. These tables contain useful tools for different aspects of system analysis, including general tracing and debugging, memory and process monitoring, performance and timing, CPU and scheduler statistics, network and socket monitoring, as well as storage and filesystems diagnostics. Each category offers a range of tools designed to help you quickly diagnose issues, tune performance, and gather insights into system behavior using BPF-based instrumentation.
| Name | Description |
|---|---|
| argdist | Display function parameter values as a histogram or frequency count. |
| bashreadline | Print entered bash commands system wide. |
| bpflist | Display processes with active BPF programs and maps. |
| capable | Trace security capability checks. |
| compactsnoop | Trace compact zone events with PID and latency. |
| criticalstat | Trace and report long atomic critical sections in the kernel. |
| deadlock | Detect potential deadlocks on a running process. |
| drsnoop | Trace direct reclaim events with PID and latency. |
| funccount | Count kernel function calls. |
| inject | Targeted error injection with call chain and predicates. |
| klockstat | Traces kernel mutex lock events and displays lock statistics. |
| opensnoop | Trace open() syscalls. |
| readahead | Show performance of read-ahead cache. |
| reset-trace | Reset the state of tracing. Maintenance tool only. |
| stackcount | Count kernel function calls and their stack traces. |
| syncsnoop | Trace sync() syscall. |
| threadsnoop | List new thread creation. |
| tplist | Display kernel tracepoints or USDT probes and their formats. |
| trace | Trace arbitrary functions, with filters. |
| ttysnoop | Watch live output from a tty or pts device. |
| ucalls | Summarize method calls or Linux syscalls in high-level languages. |
| uflow | Print a method flow graph in high-level languages. |
| ugc | Trace garbage collection events in high-level languages. |
| uobjnew | Summarize object allocation events by object type and number of bytes allocated. |
| ustat | Collect events such as GCs, thread creations, object allocations, exceptions, etc. |
| uthreads | Trace thread creation events in Java and raw pthreads. |
| Name | Description |
|---|---|
| execsnoop | Trace new processes via exec() syscalls. |
| exitsnoop | Trace process termination (exit and fatal signals). |
| killsnoop | Trace signals issued by the kill() syscall. |
| kvmexit | Display the exit_reason and its statistics of each vm exit. |
| memleak | Display outstanding memory allocations to find memory leaks. |
| numasched | Track the migration of processes between NUMAs. |
| oomkill | Trace the out-of-memory (OOM) killer. |
| pidpersec | Count new processes (via fork). |
| rdmaucma | Trace RDMA Userspace Connection Manager Access events. |
| shmsnoop | Trace System V shared memory syscalls. |
| slabratetop | Kernel SLAB/SLUB memory cache allocation rate top. |
| Name | Description |
|---|---|
| dbslower | Trace MySQL/PostgreSQL queries slower than a threshold. |
| dbstat | Summarize MySQL/PostgreSQL query latency as a histogram. |
| funcinterval | Time interval between the same function as a histogram. |
| funclatency | Time functions and show their latency distribution. |
| funcslower | Trace slow kernel or user function calls. |
| hardirqs | Measure hard IRQ (hard interrupt) event time. |
| mysqld_qslower | Trace MySQL server queries slower than a threshold. |
| ppchcalls | Summarize ppc hcall counts and latencies. |
| softirqs | Measure soft IRQ (soft interrupt) event time. |
| syscount | Summarize syscall counts and latencies. |
| Name | Description |
|---|---|
| cpudist | Summarize on- and off-CPU time per task as a histogram. |
| cpuunclaimed | Sample CPU run queues and calculate unclaimed idle CPU. |
| llcstat | Summarize CPU cache references and misses by process. |
| offcputime | Summarize off-CPU time by kernel stack trace. |
| offwaketime | Summarize blocked time by kernel off-CPU stack and waker stack. |
| profile | Profile CPU usage by sampling stack traces at a timed interval. |
| runqlat | Run queue (scheduler) latency as a histogram. |
| runqlen | Run queue length as a histogram. |
| runqslower | Trace long process scheduling delays. |
| wakeuptime | Summarize sleep-to-wakeup time by waker kernel stack. |
| wqlat | Summarize work waiting latency on workqueue. |
| Name | Description |
|---|---|
| gethostlatency | Show latency for getaddrinfo/gethostbyname[2] calls. |
| bindsnoop | Trace IPv4 and IPv6 bind() system calls (bind()). |
| netqtop | Trace and display packets distribution on NIC queues. |
| sofdsnoop | Trace FDs passed through unix sockets. |
| solisten | Trace TCP socket listen. |
| sslsniff | Sniff OpenSSL written and readed data. |
| tcpaccept | Trace TCP passive connections (accept()). |
| tcpconnect | Trace TCP active connections (connect()). |
| tcpconnlat | Trace TCP active connection latency (connect()). |
| tcpdrop | Trace kernel-based TCP packet drops with details. |
| tcplife | Trace TCP sessions and summarize lifespan. |
| tcpretrans | Trace TCP retransmits and TLPs. |
| tcprtt | Trace TCP round trip time. |
| tcpstates | Trace TCP session state changes with durations. |
| tcpsubnet | Summarize and aggregate TCP send by subnet. |
| tcpsynbl | Show TCP SYN backlog. |
| tcptop | Summarize TCP send/recv throughput by host. Top for TCP. |
| tcptracer | Trace TCP established connections (connect(), accept(), close()). |
| tcpcong | Trace TCP socket congestion control status duration. |
| Name | Description |
|---|---|
| bitesize | Show per process I/O size histogram. |
| cachestat | Trace page cache hit/miss ratio. |
| cachetop | Trace page cache hit/miss ratio by processes. |
| dcsnoop | Trace directory entry cache (dcache) lookups. |
| dcstat | Directory entry cache (dcache) stats. |
| biolatency | Summarize block device I/O latency as a histogram. |
| biotop | Top for disks: Summarize block device I/O by process. |
| biopattern | Identify random/sequential disk access patterns. |
| biosnoop | Trace block device I/O with PID and latency. |
| dirtop | File reads and writes by directory. Top for directories. |
| filelife | Trace the lifespan of short-lived files. |
| filegone | Trace why file gone (deleted or renamed). |
| fileslower | Trace slow synchronous file reads and writes. |
| filetop | File reads and writes by filename and process. Top for files. |
| mdflush | Trace md flush events. |
| mountsnoop | Trace mount and umount syscalls system-wide. |
| virtiostat | Show VIRTIO device IO statistics. |
| Name | Description |
|---|---|
| btrfsdist | Summarize btrfs operation latency distribution as a histogram. |
| btrfsslower | Trace slow btrfs operations. |
| ext4dist | Summarize ext4 operation latency distribution as a histogram. |
| ext4slower | Trace slow ext4 operations. |
| nfsslower | Trace slow NFS operations. |
| nfsdist | Summarize NFS operation latency distribution as a histogram. |
| vfscount | Count VFS calls. |
| vfsstat | Count some VFS calls, with column output. |
| xfsdist | Summarize XFS operation latency distribution as a histogram. |
| xfsslower | Trace slow XFS operations. |
| zfsdist | Summarize ZFS operation latency distribution as a histogram. |
| zfsslower | Trace slow ZFS operations. |
BPFTool is a command-line utility for interacting with eBPF programs and maps in the Linux kernel. It provides a comprehensive set of commands for loading, inspecting, and debugging eBPF objects. With bpftool, users can load compiled eBPF programs into the kernel, attach them to various kernel events or network interfaces, and manage eBPF maps used for storing and sharing data between kernel and user space. It also offers powerful introspection capabilities, allowing users to examine the state of running eBPF programs, including their maps, attached probes, and verifier logs, making it an indispensable tool for eBPF developers and system administrators working with modern Linux observability and networking.
We used many times to generate vmlinux.h header file and the skeleton header files:
sudo bpftool btf dump file /sys/kernel/btf/vmlinux format c > vmlinux.h
sudo bpftool gen skeleton obj_file.o > obj_file.skel.h
Using sudo bpftool -h to show the program’s options:
Usage: bpftool [OPTIONS] OBJECT { COMMAND | help }
bpftool batch file FILE
bpftool version
OBJECT := { prog | map | link | cgroup | perf | net | feature | btf | gen | struct_ops | iter }
OPTIONS := { {-j|--json} [{-p|--pretty}] | {-d|--debug} |
{-V|--version} }
Let’s explore some of these options. First, let’s try the following simple code which count how many times getpid syscall get invoked:
#include <linux/bpf.h>
#include <bpf/bpf_helpers.h>
struct {
__uint(type, BPF_MAP_TYPE_ARRAY);
__uint(max_entries, 1);
__type(key, int);
__type(value, int);
} count SEC(".maps");
char _license[] SEC("license") = "GPL";
SEC("tracepoint/syscalls/sys_enter_getpid")
int count_getpid(void *ctx)
{
int key = 0;
int *value;
value = bpf_map_lookup_elem(&count, &key);
if (value)
(*value)++;
return 0;
}
User-space code:
#include <stdio.h>
#include <stdlib.h>
#include <unistd.h>
#include <signal.h>
#include <bpf/libbpf.h>
#include "getpid_count.skel.h"
int main(int argc, char **argv)
{
struct getpid_count *skel;
int err;
skel = getpid_count__open();
if (!skel) {
fprintf(stderr, "Failed to open BPF skeleton\n");
return 1;
}
err = getpid_count__load(skel);
if (err) {
fprintf(stderr, "Failed to load BPF skeleton: %d\n", err);
goto cleanup;
}
err = getpid_count__attach(skel);
if (err) {
fprintf(stderr, "Failed to attach BPF skeleton: %d\n", err);
goto cleanup;
}
int map_fd = bpf_map__fd(skel->maps.count);
if (map_fd < 0) {
fprintf(stderr, "Failed to get map FD\n");
goto cleanup;
}
printf("BPF program loaded and map updated. Press Ctrl+C to exit.\n");
while (1) {
sleep(1);
int lookup_key = 0;
int count = 0;
err = bpf_map__lookup_elem(skel->maps.count,
&lookup_key, sizeof(lookup_key),
&count, sizeof(count), 0);
if (err == 0) {
printf("getpid call count: %d\n", count);
} else {
fprintf(stderr, "Lookup failed for key %d: %d\n", lookup_key, err);
}
}
cleanup:
getpid_count__destroy(skel);
return 0;
}
Before compiling and running the code. Run sudo bpftool prog to list all running eBPF programs:
[...]
42: cgroup_device name sd_devices tag 2705a24f44b96941 gpl
loaded_at 2025-03-17T23:38:12-0400 uid 0
xlated 464B jited 301B memlock 4096B
43: cgroup_skb name sd_fw_egress tag 6deef7357e7b4530 gpl
loaded_at 2025-03-17T23:38:12-0400 uid 0
xlated 64B jited 67B memlock 4096B
44: cgroup_skb name sd_fw_ingress tag 6deef7357e7b4530 gpl
loaded_at 2025-03-17T23:38:12-0400 uid 0
xlated 64B jited 67B memlock 4096B
46: cgroup_device name sd_devices tag 30c3c39a95291292 gpl
loaded_at 2025-03-18T00:27:21-0400 uid 0
xlated 1664B jited 1027B memlock 4096B
You will see a list of cgroup programs running by the system. After compiling and running the previous code and then list all running eBPF code sudo bpftool prog:
46: cgroup_device name sd_devices tag 30c3c39a95291292 gpl
loaded_at 2025-03-18T00:27:21-0400 uid 0
xlated 1664B jited 1027B memlock 4096B
312: tracepoint name count_getpid tag be075f8b6a94de72 gpl
loaded_at 2025-03-18T05:38:34-0400 uid 0
xlated 152B jited 99B memlock 4096B map_ids 147
btf_id 511
Also --pretty option can be used sudo bpftool prog --pretty to display the output in prettified JSON.
[...]
"id": 312,
"type": "tracepoint",
"name": "count_getpid",
"tag": "be075f8b6a94de72",
"gpl_compatible": true,
"loaded_at": 1742290714,
"uid": 0,
"orphaned": false,
"bytes_xlated": 152,
"jited": true,
"bytes_jited": 99,
"bytes_memlock": 4096,
"map_ids": [147],
"btf_id": 511
[...]
Our code has the following properties:
id = 312
Program Type = tracepoint which represents the type of eBPF program
name = count_getpid which is the name of the function defined in the code
tag = be075f8b6a94de72 which is a hash of the compiled instructions.
gpl which is the liscence
loaded_at = 2025-03-18T05:38:34-0400 timestamp when the program was loaded
uid = 0 which indicated that loaded by root
xlated = 152B represents the size of eBPF bytecode
jited = 99B represents the size of the machine code
memlock = 4096B represents the size resrved for this program
map_ids = 147 which is the id of the map loaded in this program
btf_id = 511 which is a unique identifier that the kernel assigns to that block of BTF metadata and can inspect its details using sudo bpftool btf show id 511
BPFTool can dump eBPF bytecode using sudo bpftool prog dump xlated id 312 :
int count_getpid(void * ctx):
; int count_getpid(void *ctx)
0: (b7) r1 = 0
; int key = 0;
1: (63) *(u32 *)(r10 -4) = r1
2: (bf) r2 = r10
3: (07) r2 += -4
; value = bpf_map_lookup_elem(&count, &key);
4: (18) r1 = map[id:147]
6: (07) r1 += 264
7: (61) r0 = *(u32 *)(r2 +0)
8: (35) if r0 >= 0x1 goto pc+3
9: (67) r0 <<= 3
10: (0f) r0 += r1
11: (05) goto pc+1
12: (b7) r0 = 0
; if (value)
13: (15) if r0 == 0x0 goto pc+3
; (*value)++;
14: (61) r1 = *(u32 *)(r0 +0)
15: (07) r1 += 1
16: (63) *(u32 *)(r0 +0) = r1
; return 0;
17: (b7) r0 = 0
18: (95) exit
We can get visual representation of our code instructions using sudo bpftool prog dump xlated id 312 visual &> vis.out and the output vis.out is a DOT language file which is a graph description language and can be viewed Graphviz. It can be converted to PNG using dot -Tpng viz.out -o viz.png and you can display viz.png file.
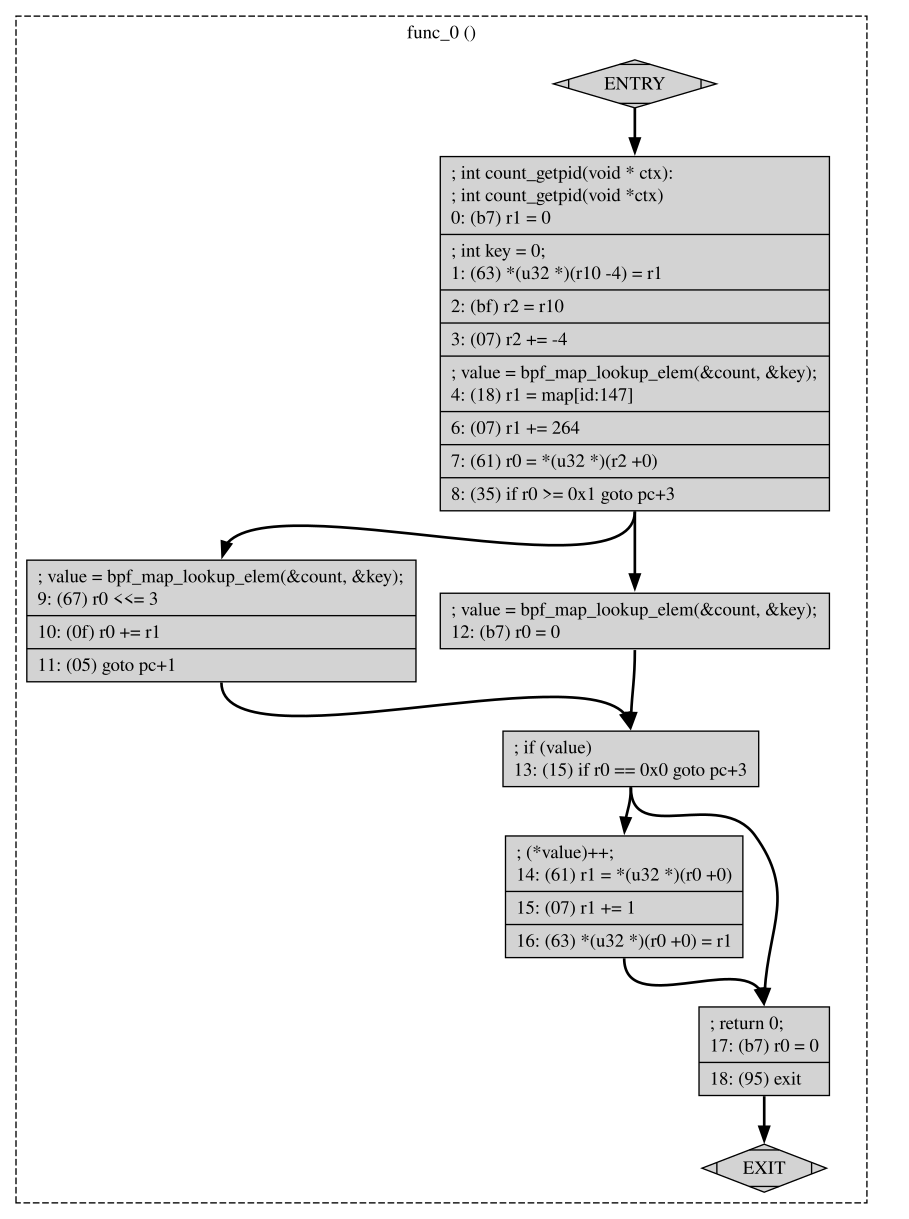
BPFTool can also dump jited or the program machine code using sudo bpftool prog dump jited id 312:
int count_getpid(void * ctx):
0xffffffffc03735d4:
; int count_getpid(void *ctx)
0: nopl (%rax,%rax)
5: nopl (%rax)
8: pushq %rbp
9: movq %rsp, %rbp
c: subq $8, %rsp
13: xorl %edi, %edi
; int key = 0;
15: movl %edi, -4(%rbp)
18: movq %rbp, %rsi
1b: addq $-4, %rsi
; value = bpf_map_lookup_elem(&count, &key);
1f: movabsq $-121297335560704, %rdi
29: addq $272, %rdi
30: movl (%rsi), %eax
33: cmpq $1, %rax
37: jae 0xffffffffc0373616
39: shlq $3, %rax
3d: addq %rdi, %rax
40: jmp 0xffffffffc0373618
42: xorl %eax, %eax
; if (value)
44: testq %rax, %rax
47: je 0xffffffffc0373627
; (*value)++;
49: movl (%rax), %edi
4c: addq $1, %rdi
50: movl %edi, (%rax)
; return 0;
53: xorl %eax, %eax
55: leave
56: jmp 0xffffffff85f0410b
make LLVM_CONFIG=$(which llvm-config) CFLAGS_EXTRA="-DENABLE_JIT_DISASM=1" to ensure that LLVM was correctly detected and that JIT disassembly support was enabled.
llvm-objdump -S getpid.o
getpid.o: file format elf64-bpf
Disassembly of section tracepoint/syscalls/sys_enter_getpid:
0000000000000000 <count_getpid>:
; {
0: b7 01 00 00 00 00 00 00 r1 = 0x0
; int key = 0;
1: 63 1a fc ff 00 00 00 00 *(u32 *)(r10 - 0x4) = r1
2: bf a2 00 00 00 00 00 00 r2 = r10
3: 07 02 00 00 fc ff ff ff r2 += -0x4
; value = bpf_map_lookup_elem(&count, &key);
4: 18 01 00 00 00 00 00 00 00 00 00 00 00 00 00 00 r1 = 0x0 ll
6: 85 00 00 00 01 00 00 00 call 0x1
; if (value)
7: 15 00 03 00 00 00 00 00 if r0 == 0x0 goto +0x3 <count_getpid+0x58>
; (*value)++;
8: 61 01 00 00 00 00 00 00 r1 = *(u32 *)(r0 + 0x0)
9: 07 01 00 00 01 00 00 00 r1 += 0x1
10: 63 10 00 00 00 00 00 00 *(u32 *)(r0 + 0x0) = r1
; return 0;
11: b7 00 00 00 00 00 00 00 r0 = 0x0
12: 95 00 00 00 00 00 00 00 exit
You can find a list of eBPF opcodes from kernel documentation or RFC 9669.
BPFTool can display the list of all maps using sudo bpftool map
11: hash_of_maps name cgroup_hash flags 0x0
key 8B value 4B max_entries 2048 memlock 165152B
147: array name count flags 0x0
key 4B value 4B max_entries 1 memlock 272B
btf_id 511
We can also inspect map content with id 147 using sudo bpftool map dump id 147
[{
"key": 0,
"value": 22 # count of how many times `getpid` syscall get invoked
}
]
Maps can be updated using bpftool. For example, let’s change the value to 90 sudo bpftool map update id 147 key 00 00 00 00 value 90 00 00 00 and inspect the content again sudo bpftool map dump id 147 you might see:
[{
"key": 0,
"value": 98
}
]
The extra 8 indicates that between your update and the dump, the getpid syscall was triggered 8 times, and since your eBPF program increments the value each time getpid is called, the counter increased from 90 to 98.
Maps also can be pinned to eBPF filesystem using sudo bpftool map pin id 147 /sys/fs/bpf/getpid_map and even after termination of our program we can dump the content of the pinned map using sudo bpftool map dump pinned /sys/fs/bpf/getpid_map
[{
"key": 0,
"value": 122
}
]
We can unpin simply by remove the created file sudo rm /sys/fs/bpf/getpid_map.
BPFTool can also load programs. Let’s close our program and load it again using:
sudo bpftool prog loadall getpid.o /sys/fs/bpf/test autoattach and then run sudo bpftool prog to make sure that the program is loaded:
741: tracepoint name count_getpid tag be075f8b6a94de72 gpl
loaded_at 2025-03-18T07:03:14-0400 uid 0
xlated 152B jited 99B memlock 4096B map_ids 85
btf_id 189
autoattach option is to load, attach and pin kprobe, kretprobe, uprobe, uretprobe and tracepoints in a single command.
We can again dump the content of the program map sudo bpftool map dump id 85
[{
"key": 0,
"value": 24
}
]
BPFTool can also load and attach another types of eBPF programs such as XDP. Let’s see the following code of XDP which drops ingress traffic to port 8080:
#include <linux/bpf.h>
#include <linux/if_ether.h>
#include <linux/ip.h>
#include <linux/tcp.h>
#include <bpf/bpf_helpers.h>
#include <bpf/bpf_endian.h>
#include <linux/in.h>

char _license[] SEC("license") = "GPL";

SEC("xdp")
int drop_ingress_port_8080(struct xdp_md *ctx) {
    void *data = (void *)(long)ctx->data;
    void *data_end = (void *)(long)ctx->data_end;

    struct ethhdr *eth = data;
    if ((void *)eth + sizeof(*eth) > data_end)
        return XDP_PASS;

    if (bpf_ntohs(eth->h_proto) != ETH_P_IP)
        return XDP_PASS;

    struct iphdr *iph = data + sizeof(*eth);
    if ((void *)iph + sizeof(*iph) > data_end)
        return XDP_PASS;

    if (iph->protocol != IPPROTO_TCP)
        return XDP_PASS;

    int ip_header_length = iph->ihl * 4;

    struct tcphdr *tcph = data + sizeof(*eth) + ip_header_length;
    if ((void *)tcph + sizeof(*tcph) > data_end)
        return XDP_PASS;

    if (bpf_ntohs(tcph->dest) == 8080) {
        bpf_printk("Dropping XDP egress packet port 8080\n");
        return XDP_DROP;
    }

    return XDP_PASS;
}
We can load this program using sudo bpftool prog load xdp_drop8080.o /sys/fs/bpf/xdp type xdp. Then running sudo bpftool prog list pinned /sys/fs/bpf/xdp to see if the program is loaded successfully:
835: xdp name drop_egress_port_8080 tag 7c15f4a6de3ceb0f gpl
loaded_at 2025-03-18T07:24:28-0400 uid 0
xlated 248B jited 164B memlock 4096B map_ids 122
btf_id 310
Then we can attach this program to an interface sudo bpftool net attach xdp id 835 dev enp1s0. To confirm program is attached use sudo bpftool net list:
xdp:
enp1s0(2) driver id 835
tc:
flow_dissector:
netfilter:
Or by viewing ip a:
2: enp1s0: <BROADCAST,MULTICAST,UP,LOWER_UP> mtu 1500 xdp/id:835 qdisc fq_codel state UP group default qlen 1000
link/ether 52:54:00:f6:fe:bc brd ff:ff:ff:ff:ff:ff
altname enx525400f6febc
inet 192.168.1.238/24 brd 192.168.1.255 scope global dynamic noprefixroute enp1s0
valid_lft 3543sec preferred_lft 3543sec
inet6 fe80::5054:ff:fef6:febc/64 scope link noprefixroute
valid_lft forever preferred_lft forever
We can see xdp/id:835 which confirms program with id 835 of type XDP is attached to enp1s0 interface. Use sudo bpftool net detach xdp dev enp1s0 to detach the XDP program.
Unloading eBPF program can be done by removing the pinned pseudofile. For example, sudo rm /sys/fs/bpf/xdp to unload the XDP program. We can also use bpftool to load and attached TC programs with tcx_egress for egress traffic and tcx_ingress for ingress traffic. For example, sudo bpftool net attach tcx_egress id 423 dev enp1s0.
Tail calls in eBPF let you chain together multiple BPF programs, effectively bypassing the instruction limit imposed on individual programs which is around 4096 instructions before kernel 5.2 and now the limit is one million instructions. Tail calls can also be used to break up the code logic into multiple parts to enable modular design. Tail call transfers control from one eBPF program to another without returning to the caller. 1. The verifier ensures that tail calls do not lead to unbounded recursion and that the jump is safe. It also reduces the effective stack size available (e.g., from 512 bytes to 256 bytes) when tail calls are used with BPF-to-BPF function calls.
BPF_MAP_TYPE_PROG_ARRAY that holds file descriptors of other BPF programs. The tail call uses an index (or key) into this map to know which program to jump to.bpf_tail_call(ctx, prog_array, key) to transfer execution to another program. If the call is successful, the current program’s execution ends and the new program starts from its entry point.Let’s explore an example of XDP code. The idea is to have a main XDP program that inspects incoming packets and, based on the TCP destination port, uses a tail call to jump to the appropriate program—one for port 8080 and one for port 22.
#include <linux/bpf.h>
#include <bpf/bpf_helpers.h>
#include <bpf/bpf_endian.h>
#include <linux/if_ether.h>
#include <linux/ip.h>
#include <linux/tcp.h>
#include <linux/in.h>
struct {
__uint(type, BPF_MAP_TYPE_PROG_ARRAY);
__uint(max_entries, 2);
__uint(key_size, sizeof(int));
__uint(value_size, sizeof(int));
} prog_array SEC(".maps");
char _license[] SEC("license") = "GPL";
SEC("xdp")
int main_prog(struct xdp_md *ctx)
{
void *data = (void *)(long)ctx->data;
void *data_end = (void *)(long)ctx->data_end;
struct ethhdr *eth = data;
struct iphdr *iph;
struct tcphdr *tcph;
if (data + sizeof(*eth) > data_end)
return XDP_ABORTED;
if (eth->h_proto != bpf_htons(ETH_P_IP))
return XDP_PASS;
iph = data + sizeof(*eth);
if ((void *)iph + sizeof(*iph) > data_end)
return XDP_ABORTED;
if (iph->protocol != IPPROTO_TCP)
return XDP_PASS;
tcph = (void *)iph + (iph->ihl * 4);
if ((void *)tcph + sizeof(*tcph) > data_end)
return XDP_ABORTED;
int dport = bpf_ntohs(tcph->dest);
if (dport == 8080) {
int key = 0;
bpf_tail_call(ctx, &prog_array, key);
} else if (dport == 22) {
int key = 1;
bpf_tail_call(ctx, &prog_array, key);
}
return XDP_PASS;
}
SEC("xdp")
int port8080_prog(struct xdp_md *ctx)
{
bpf_printk("Packet to port 8080 processed\n");
return XDP_PASS;
}
SEC("xdp")
int port22_prog(struct xdp_md *ctx)
{
bpf_printk("Packet to port 22 processed\n");
return XDP_PASS;
}
User-space code:
#include <stdio.h>
#include <stdlib.h>
#include <unistd.h>
#include <errno.h>
#include <net/if.h>
#include <bpf/libbpf.h>
#include "tail_call.skel.h"
#ifndef libbpf_is_err
#define libbpf_is_err(ptr) ((unsigned long)(ptr) > (unsigned long)-1000L)
#endif
int main(int argc, char **argv)
{
struct tail_call *skel;
struct bpf_link *link = NULL;
int err, key, prog_fd;
int ifindex;
const char *ifname;
if (argc < 2) {
fprintf(stderr, "Usage: %s <interface>\n", argv[0]);
return 1;
}
ifname = argv[1];
skel = tail_call__open();
if (!skel) {
fprintf(stderr, "Failed to open BPF skeleton\n");
return 1;
}
err = tail_call__load(skel);
if (err) {
fprintf(stderr, "Failed to load BPF skeleton: %d\n", err);
goto cleanup;
}
key = 0;
prog_fd = bpf_program__fd(skel->progs.port8080_prog);
if (prog_fd < 0) {
fprintf(stderr, "Invalid FD for port8080_prog\n");
goto cleanup;
}
err = bpf_map__update_elem(skel->maps.prog_array,
&key, sizeof(key),
&prog_fd, sizeof(prog_fd),
0);
if (err) {
fprintf(stderr, "Failed to update prog_array for port8080_prog: %d\n", err);
goto cleanup;
}
key = 1;
prog_fd = bpf_program__fd(skel->progs.port22_prog);
if (prog_fd < 0) {
fprintf(stderr, "Invalid FD for port22_prog\n");
goto cleanup;
}
err = bpf_map__update_elem(skel->maps.prog_array,
&key, sizeof(key),
&prog_fd, sizeof(prog_fd),
0);
if (err) {
fprintf(stderr, "Failed to update prog_array for port22_prog: %d\n", err);
goto cleanup;
}
ifindex = if_nametoindex(ifname);
if (!ifindex) {
perror("if_nametoindex");
goto cleanup;
}
link = bpf_program__attach_xdp(skel->progs.main_prog, ifindex);
if (libbpf_is_err(link)) {
err = libbpf_get_error(link);
fprintf(stderr, "Failed to attach XDP program on %s (ifindex: %d): %d\n",
ifname, ifindex, err);
link = NULL;
goto cleanup;
}
printf("XDP program loaded and tail calls configured on interface %s (ifindex: %d).\n",
ifname, ifindex);
printf("Press Ctrl+C to exit...\n");
while (1)
sleep(1);
cleanup:
if (link)
bpf_link__destroy(link);
tail_call__destroy(skel);
return err < 0 ? -err : 0;
}
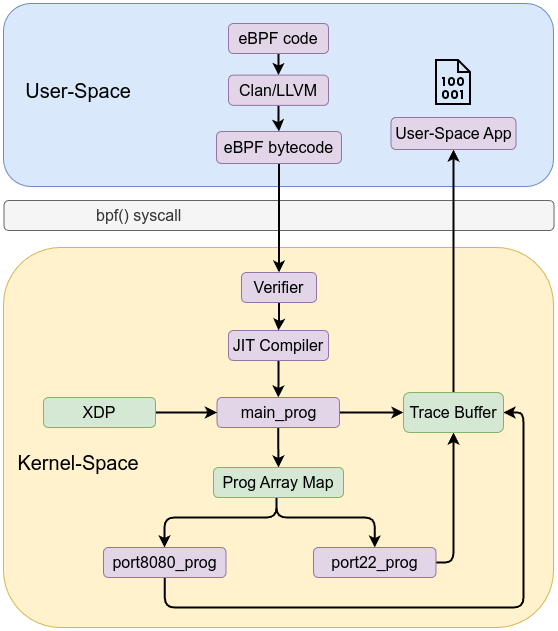
Compile the code
clang -g -O2 -target bpf -c tail_call.c -o tail_call.o
sudo bpftool gen skeleton tail_call.o > tail_call.skel.h
clang -o loader loader.c -lbpf
Run the loader using sudo ./loader enp1s0 . Open trace buffer sudo cat /sys/kernel/debug/tracing/trace_pipe:
<idle>-0 [003] ..s2. 8853.538349: bpf_trace_printk: Packet to port 8080 processed
<idle>-0 [003] .Ns2. 8853.539270: bpf_trace_printk: Packet to port 8080 processed
<idle>-0 [003] .Ns2. 8853.539279: bpf_trace_printk: Packet to port 8080 processed
gnome-shell-2539 [003] ..s1. 8853.541321: bpf_trace_printk: Packet to port 8080 processed
gnome-shell-2539 [003] ..s1. 8853.541334: bpf_trace_printk: Packet to port 8080 processed
<idle>-0 [003] ..s2. 8860.777125: bpf_trace_printk: Packet to port 22 processed
<idle>-0 [003] ..s2. 8860.777420: bpf_trace_printk: Packet to port 22 processed
<idle>-0 [003] ..s2. 8860.777611: bpf_trace_printk: Packet to port 22 processed
llvmpipe-1-2569 [003] ..s1. 8860.783551: bpf_trace_printk: Packet to port 22 processed